The platform that turns workforce data into capital allocation decisions.
INOP Strategic Workforce Planning connects strategy, finance, people, market, and AI data into one decision intelligence layer, giving leaders a clear view of execution risk, capability gaps, and exactly where to invest.
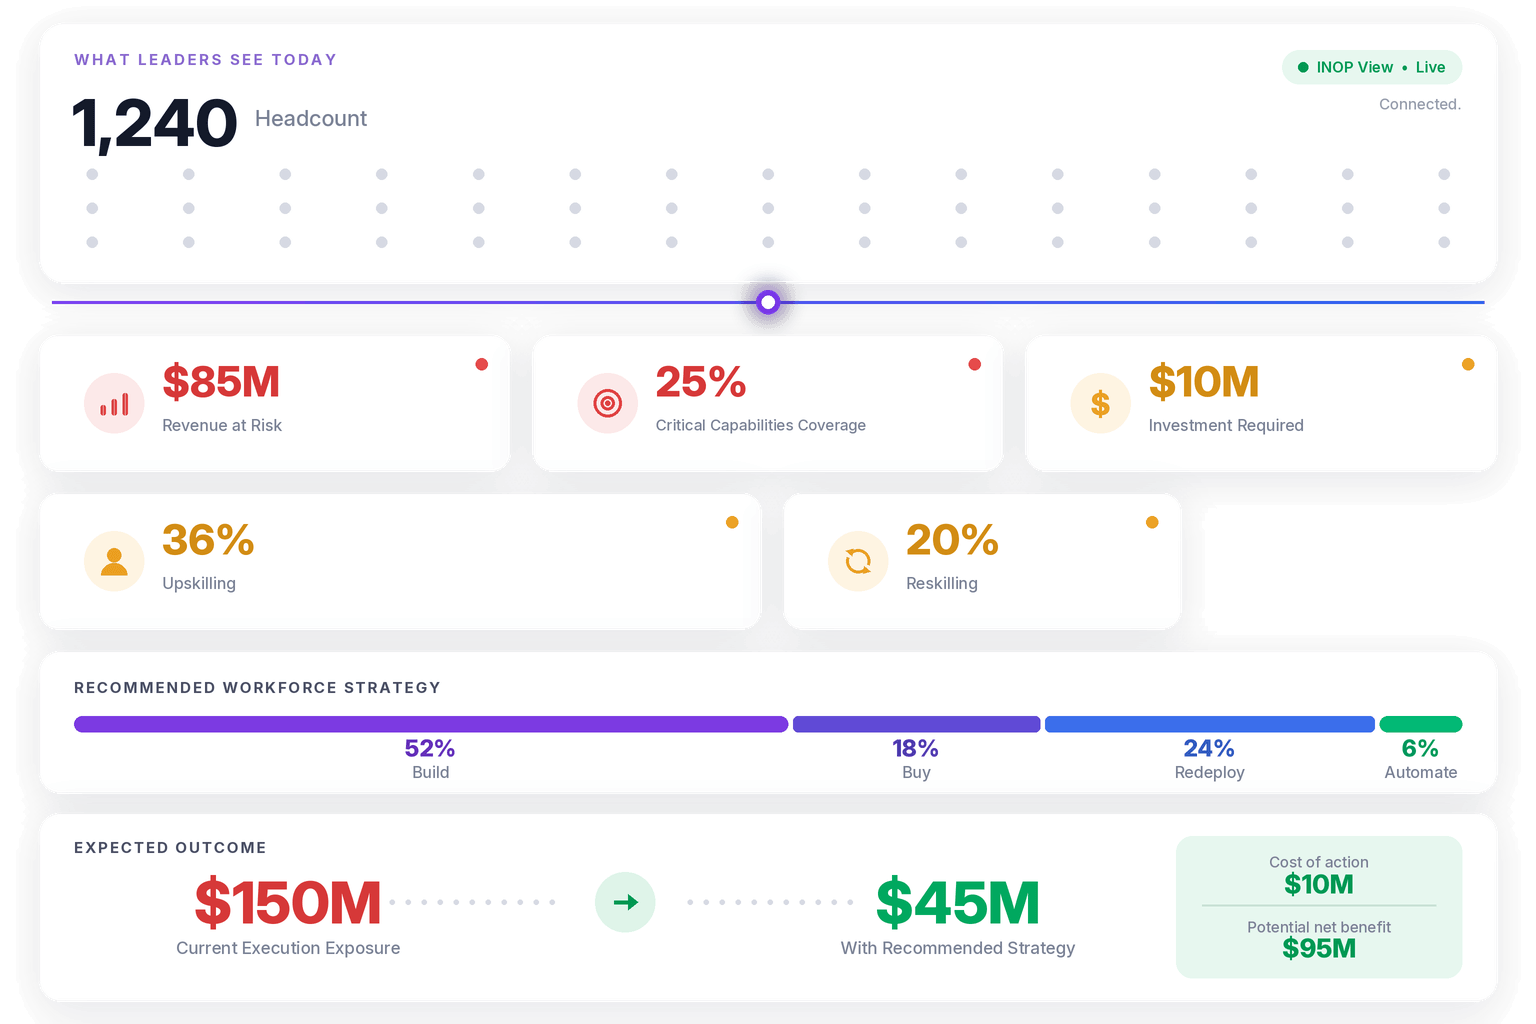
Most leadership teams cannot answer these questions. INOP is built so they can.
These are the questions boards, investors, and CEOs are asking right now, and that most workforce tools were never designed to answer.

What capabilities, roles and skills do we actually have?
Real-time mapping across the entire organisation, teams, roles, and people.

Where are the gaps, and what will they cost if we do nothing?
Gaps tied to strategic priorities with financial exposure and cost of inaction per gap.

What workforce risks could delay or derail execution?
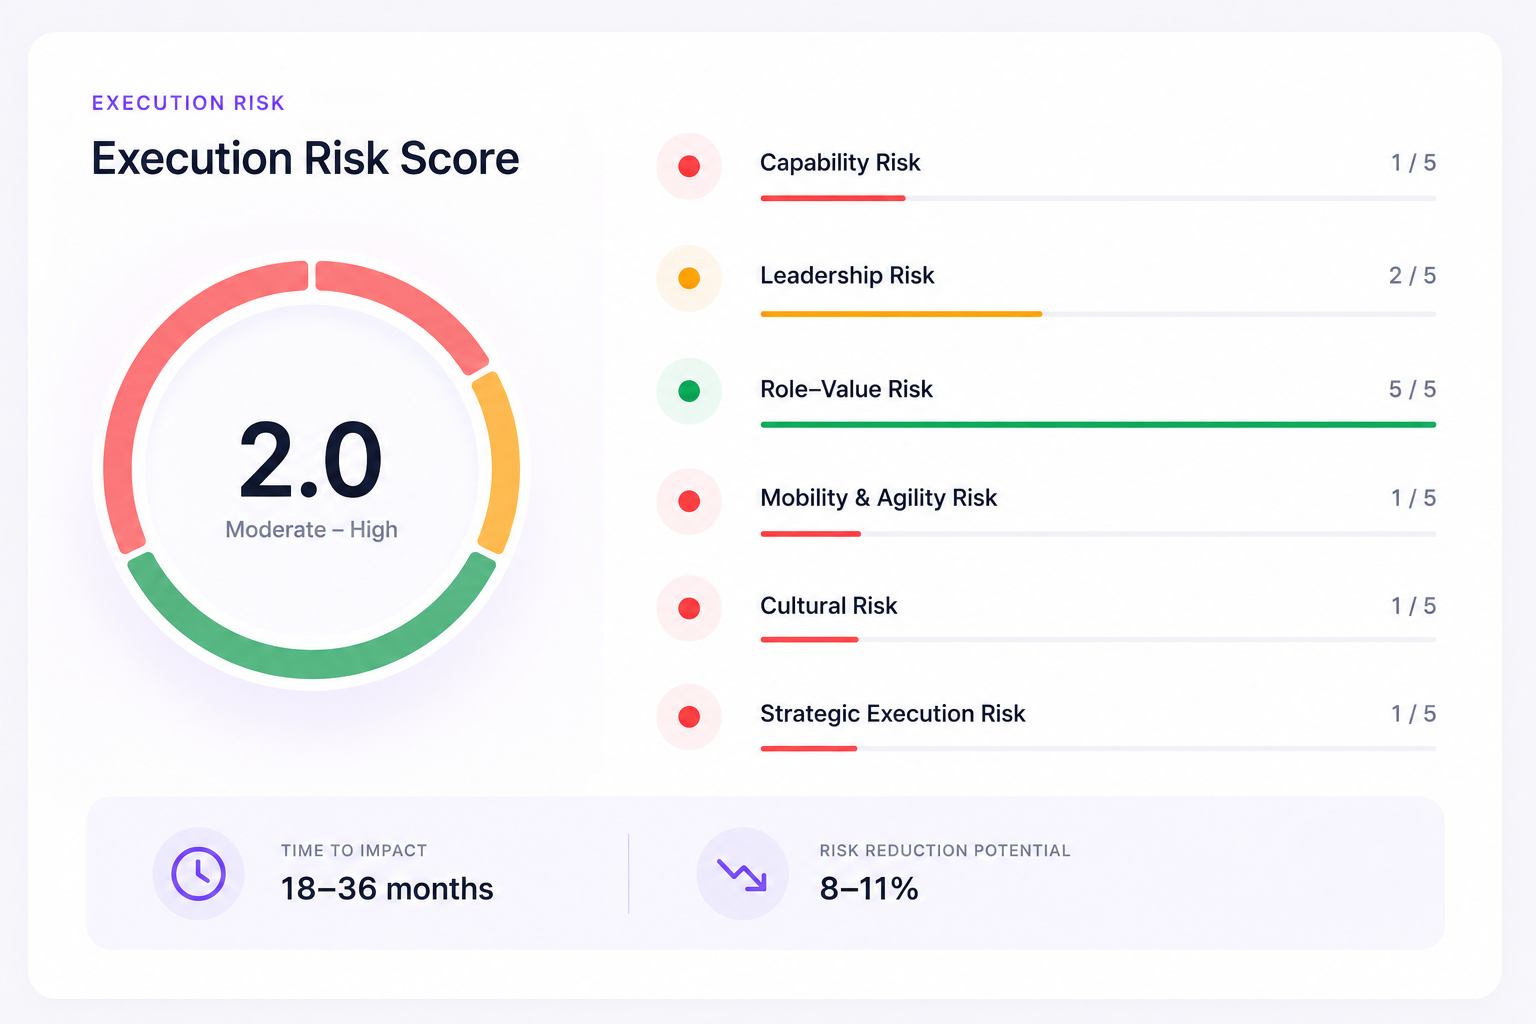
Quantified risk scores with financial impact across six interconnected domains.

Where should we invest, redeploy, automate, or scale back?
Build, Buy, Redeploy, or Automate, with trade-offs quantified across cost, time, and risk.

What is the business impact across timeframes and scenarios?
Recommendations sequenced across 180-day, 1-year, and 3-year horizons, each sized by ROI.
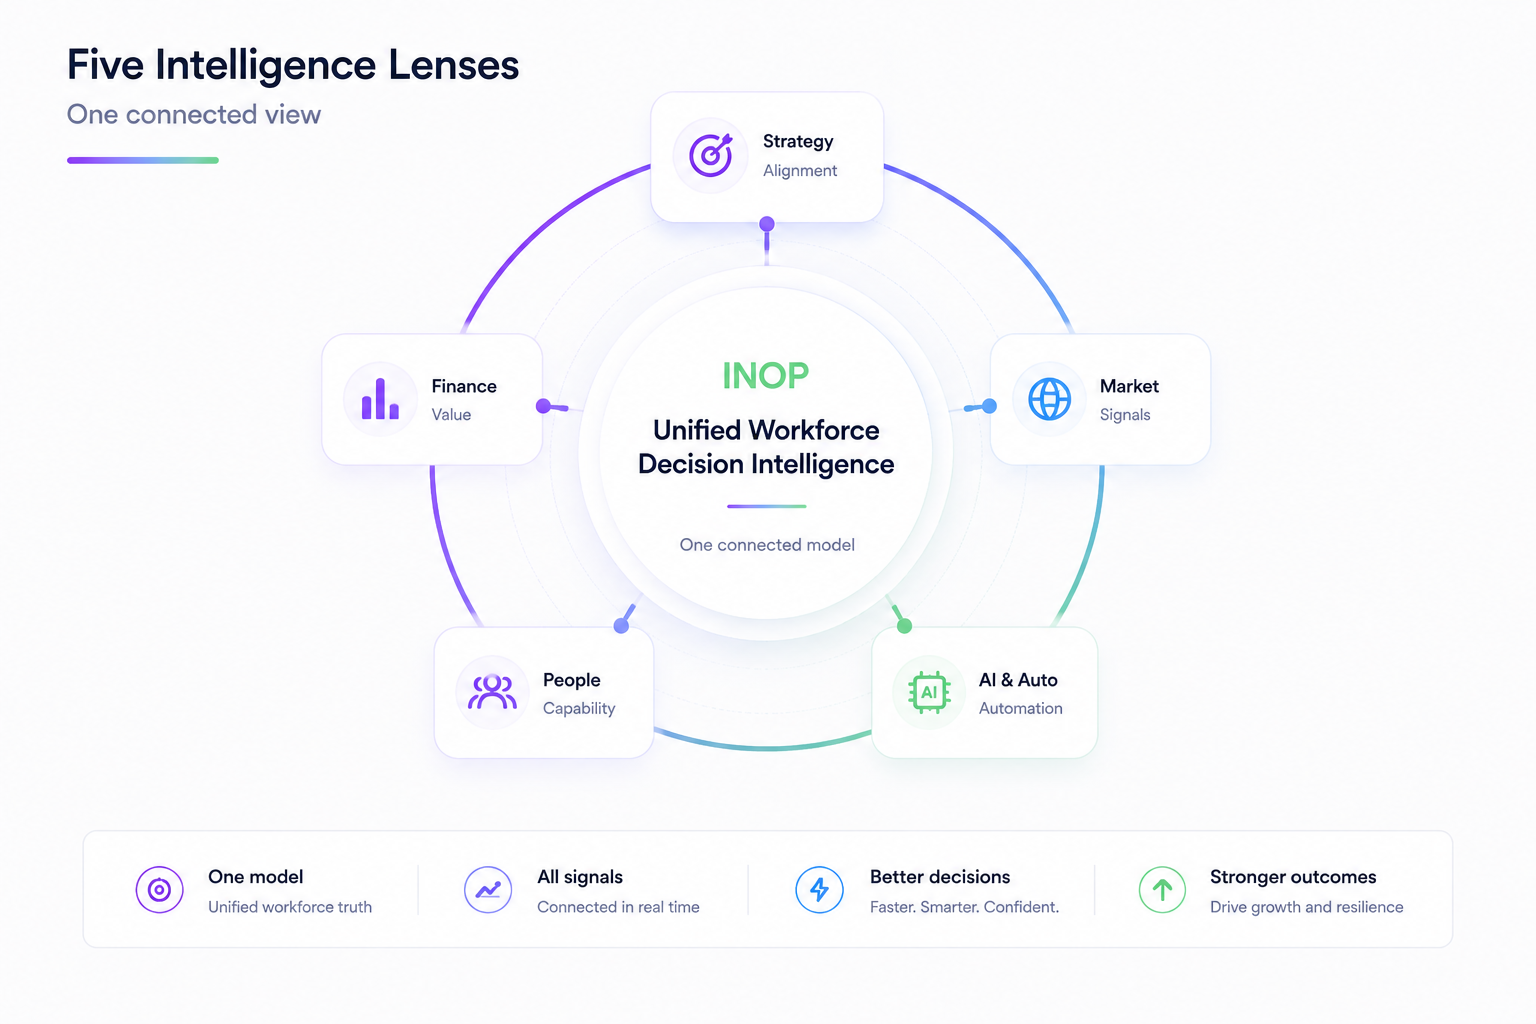
Five intelligence lenses. Six risk domains. One composite view.
A capability gap in isolation is an HR observation. Connected to financial exposure, automation trajectory, market signals, and execution risk it becomes a board-level decision.
Capability gaps
Skill coverage vs strategy at role, team, and employee level.
Succession & depth
Bench depth, AI literacy, transformation sponsorship.
Redeployment capacity
Skills adjacency and reskilling feasibility.
Critical vs declining
Cost-to-value ratio and future role gaps.
Change readiness
Values fit and transformation capacity.
06 — Strategic Execution Risk
Composite domain. Scored 0–5. Probability and estimated cost of workforce-driven strategic failure. Feeds board reporting, investor disclosure, and all BBRA decisions.
Your taxonomy, our taxonomy, or a blend. You choose.
Every INOP analysis is built on a structured taxonomy layer. We provide our own, we can work with yours, or we build a blended approach. Either way the intelligence is anchored to a consistent, validated foundation.
A continuously updated, proprietary skills library mapped to external market demand signals.
Continuously updated against external market signals and AI/automation exposure data. Use INOP's taxonomy, bring your own, or blend both.
A structured role library covering 2,400+ roles, classified by strategic importance and value trajectory.
Roles classified as critical, emerging, stable, declining, or sunset. Use INOP's role library, bring your own job architecture, or blend both.
Two things no other platform puts a number on.
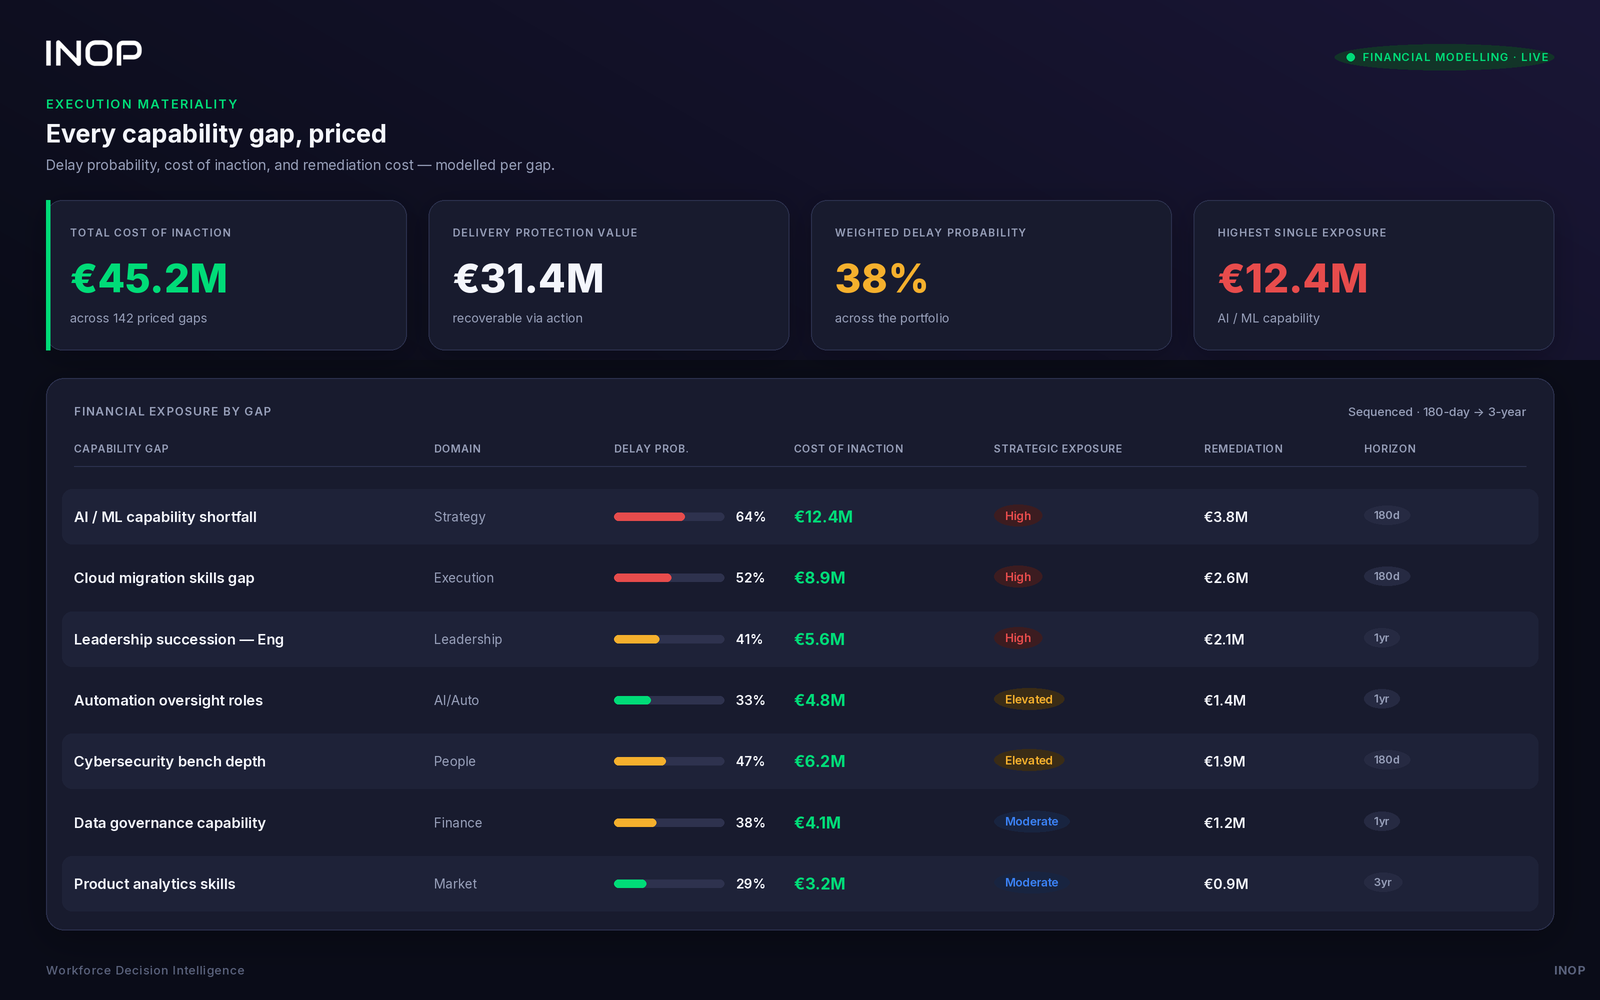
Most workforce tools identify gaps. INOP quantifies what those gaps cost, whether the risk sits in a transformation programme, a market entry, a leadership transition, a technology rollout, or a scaling business.
A capability or leadership gap sounds manageable in isolation. It rarely is when you connect it to what it blocks.
INOP connects every identified gap to four financial exposure layers, applicable across capital-intensive projects, service businesses, technology transformations, and scaling organisations. Delay probability, cost of delay, strategic exposure, and remediation cost. All sized and sequenced.
The number that changes the board conversation is the delivery protection value — not the headcount saving.
Not how many jobs. Which tasks, at what pace, and what is the materiality impact on your cost base?
INOP assesses every task in every role against three states, then converts exposure directly into financial materiality impact:
INOP puts a materiality number on AI exposure per role, per function, and across the organisation — so automation decisions are made on financial logic, not intuition.
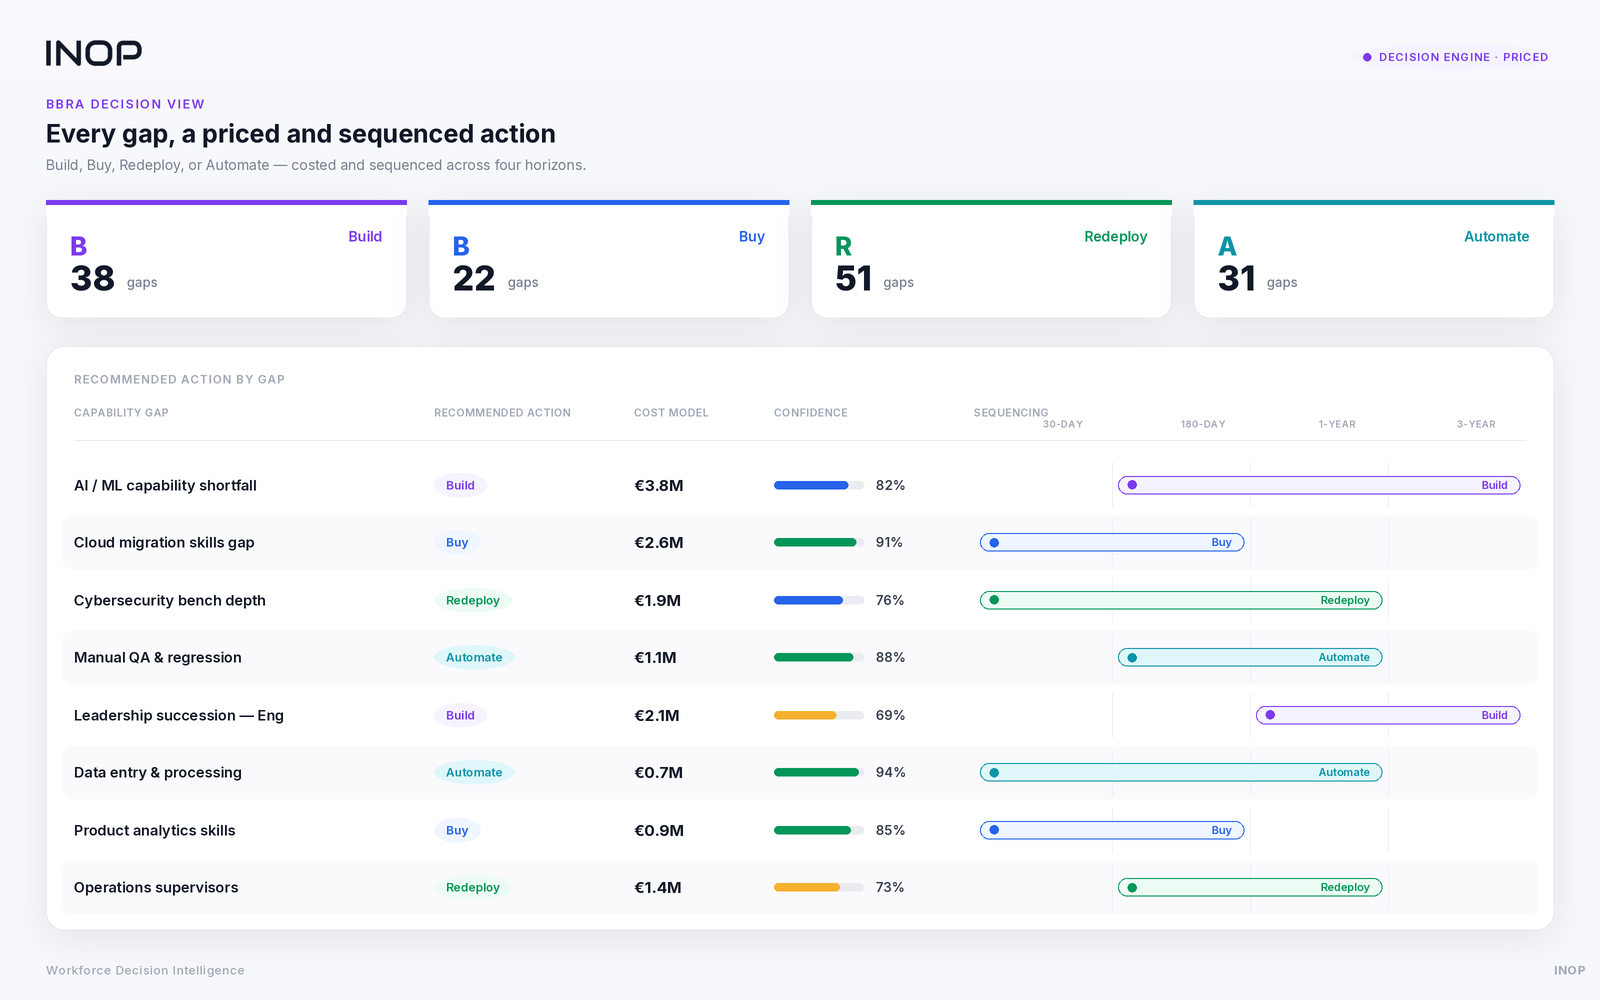
Every gap generates a recommended action. Every action comes with a price tag.
For each gap identified across the six domains, INOP models four response pathways. Each is priced using real-time compensation benchmarks, scored for market feasibility, and sequenced across 30-day, 180-day, 1-year, and 3-year horizons.
Build
Upskilling pathways with time-to-competency and cost vs hiring. ROI modelled per pathway.
Buy
When speed or scarcity makes building too slow. Market availability and compensation benchmarks included.
Redeploy
Skills adjacency scored across the workforce. Mobility plan with transition sequencing.
Automate
Task-level AI scoring and FTE displacement modelled per role. Automation investment case with financial consequence.
From intake to continuous intelligence. Five phases.
INOP guides the process from data submission to live platform access. Initial analysis delivered within 48 hours of complete data submission.
Built for enterprise use. Designed for governance.
INOP integrates with existing HR, finance, and business systems. Every output is explainable, auditable, and persona-ready. Your data stays private, protected, and yours.
SOC 2 Type II Certified
Security controls independently audited across availability, confidentiality, and processing integrity.
ISO 27001 Certified
International standard for information security management. Full certification across the platform.
GDPR Compliant
Fully encrypted at rest and in transit. Data residency in Europe. DPA on request. Your data is never used to train AI models.
Data Isolation
Each client's data is fully isolated. No cross-client data sharing. Client retains ownership of all submitted data.
API & System Integration
Secure API connections to existing HRIS, ATS, LMS, and finance systems. No unnecessary data movement.
Explainable Outputs
Confidence scoring and source attribution on all outputs. Audit trails on all data access. Built for board packs and regulatory review.
Role-Based Access
Granular permissions per user role. C-suite, HR, finance, and board views configurable per engagement.
Live External Signals
Continuously updated with market, sector, and AI signals. Always current, never point-in-time.