Compensation Analytics

Compensation intelligence built into your workforce decisions.

Benchmarking, compensation review rounds, pay equity, skills-based pay, and EU Pay Transparency compliance, where every benchmark is already inside a decision, not waiting in a report.
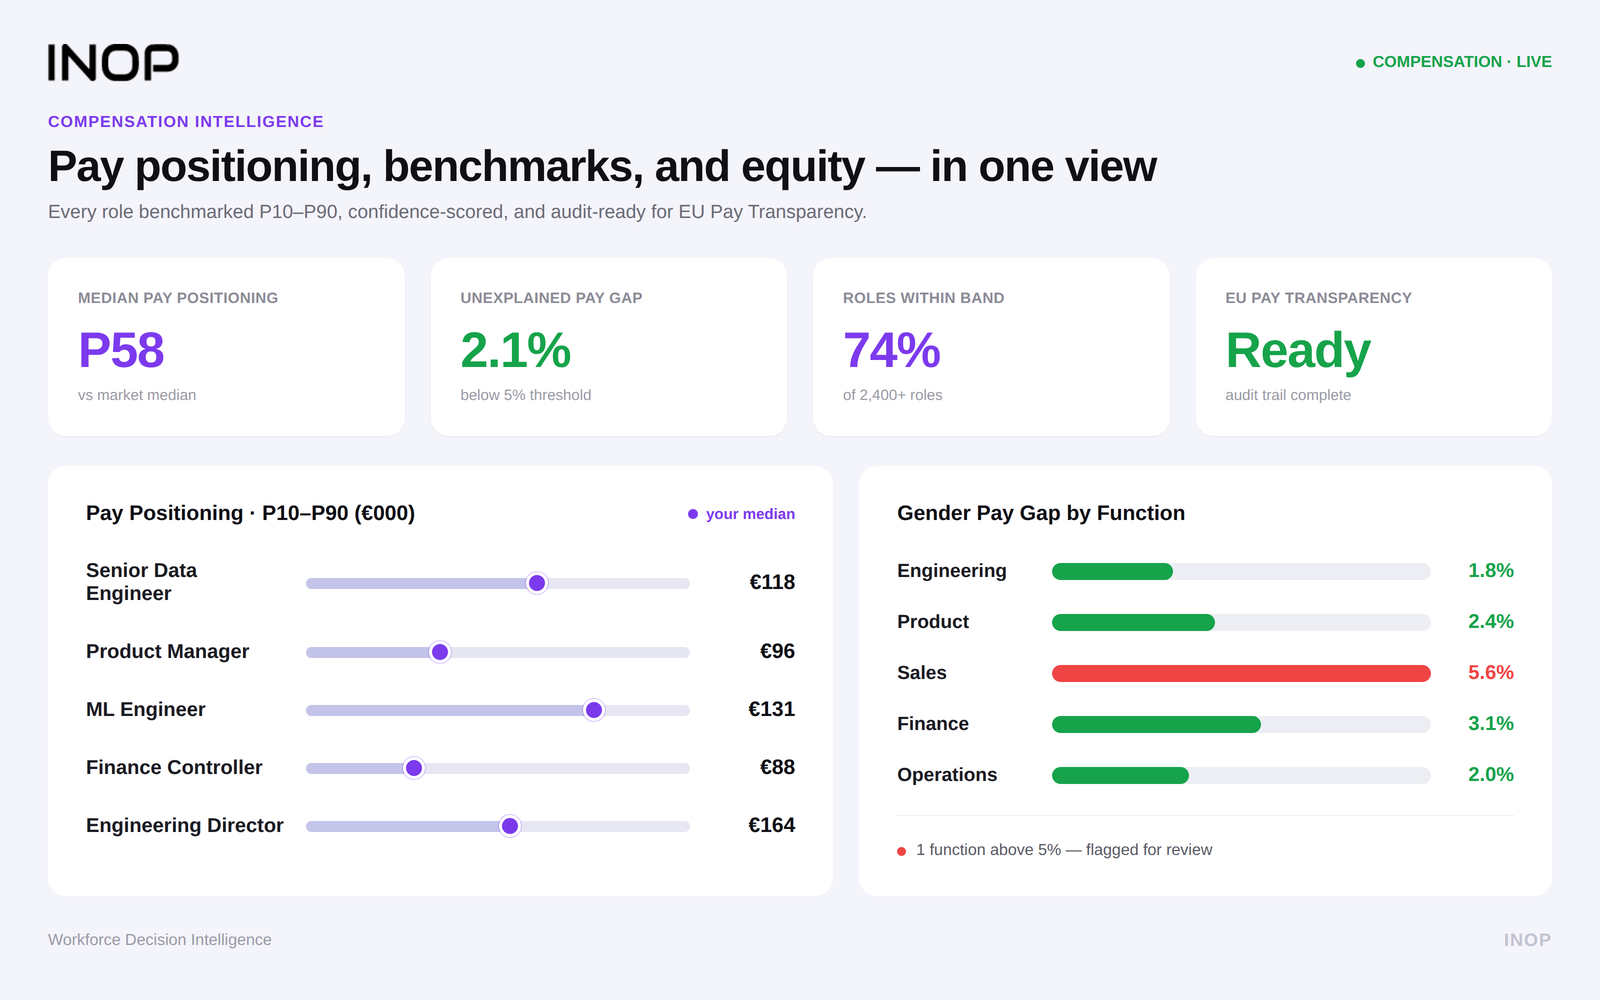
inop compensation Analytics platform
Trusted by leadership teams and investors navigating complex workforce decisions
Skyborn Renewables Hypoport SE BUX ImFusion Allchiefs Broadridge
Compensation Benchmarking

Know exactly where you stand in the market, for every role, level, and geography.

Real-time salary benchmarks across roles, seniority levels, industries, and geographies, including competitive peer positioning so you know whether you are ahead, level, or behind the organisations competing for the same talent.
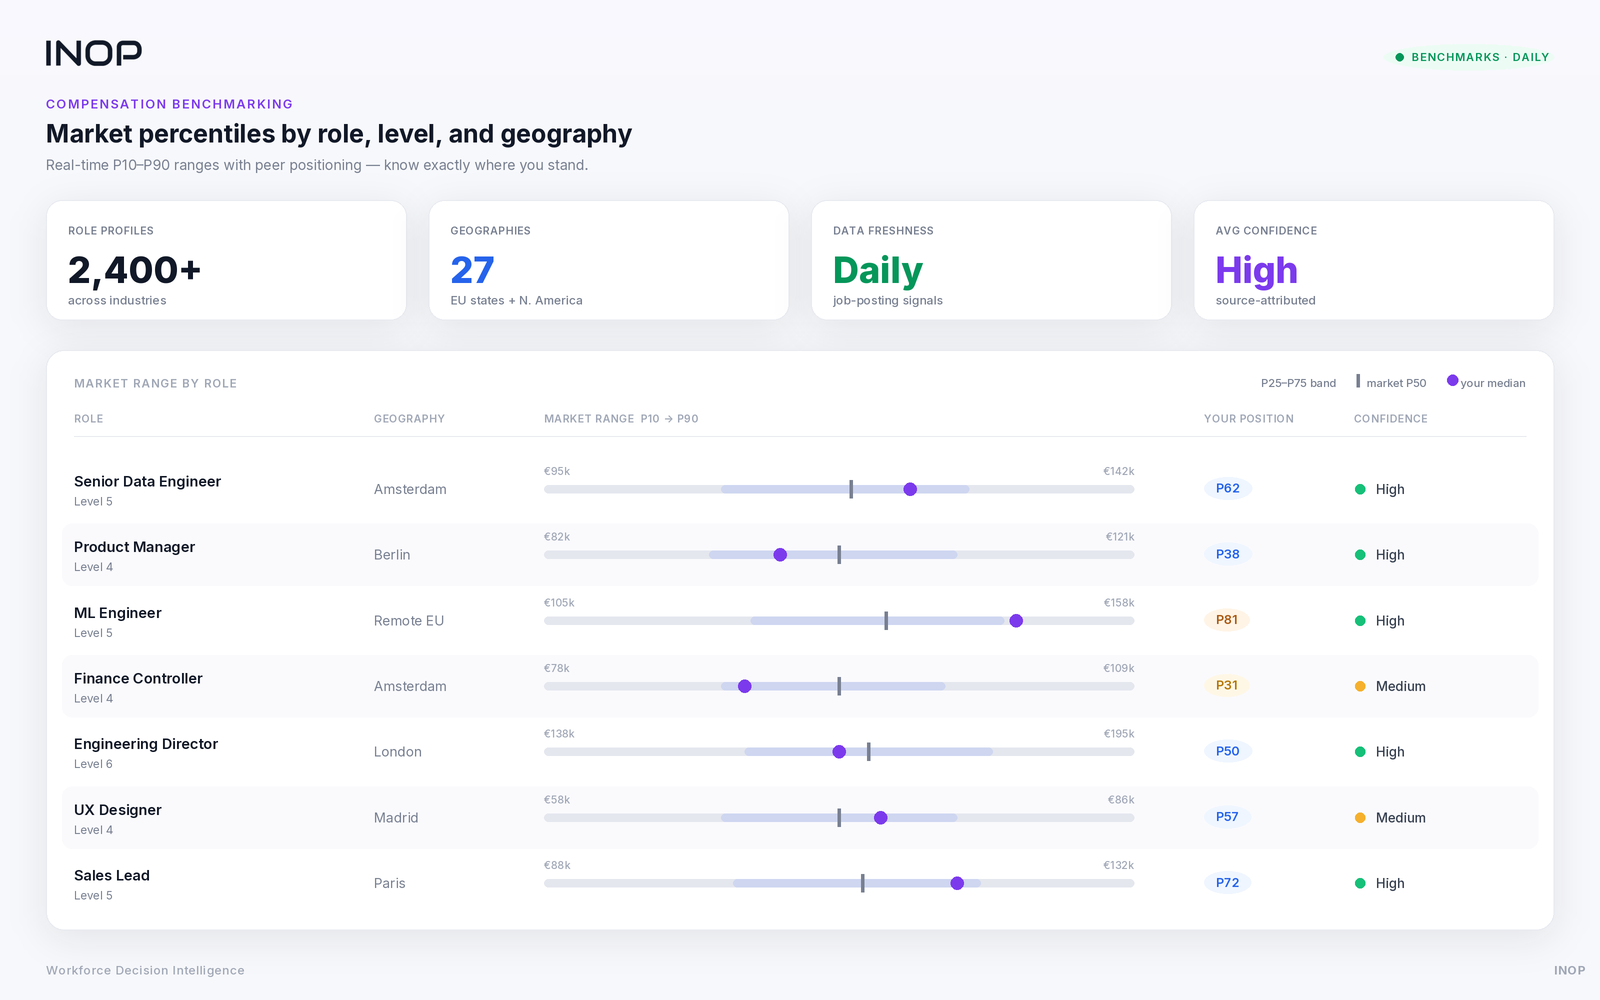
P25 / P50 / P75 / P90 Europe & North America 2,400+ role profiles Competitive peer positioning Industry-specific Real-time
Compensation Review Rounds

A structured, seven-step review process that connects pay decisions to equity, transparency, and compliance.

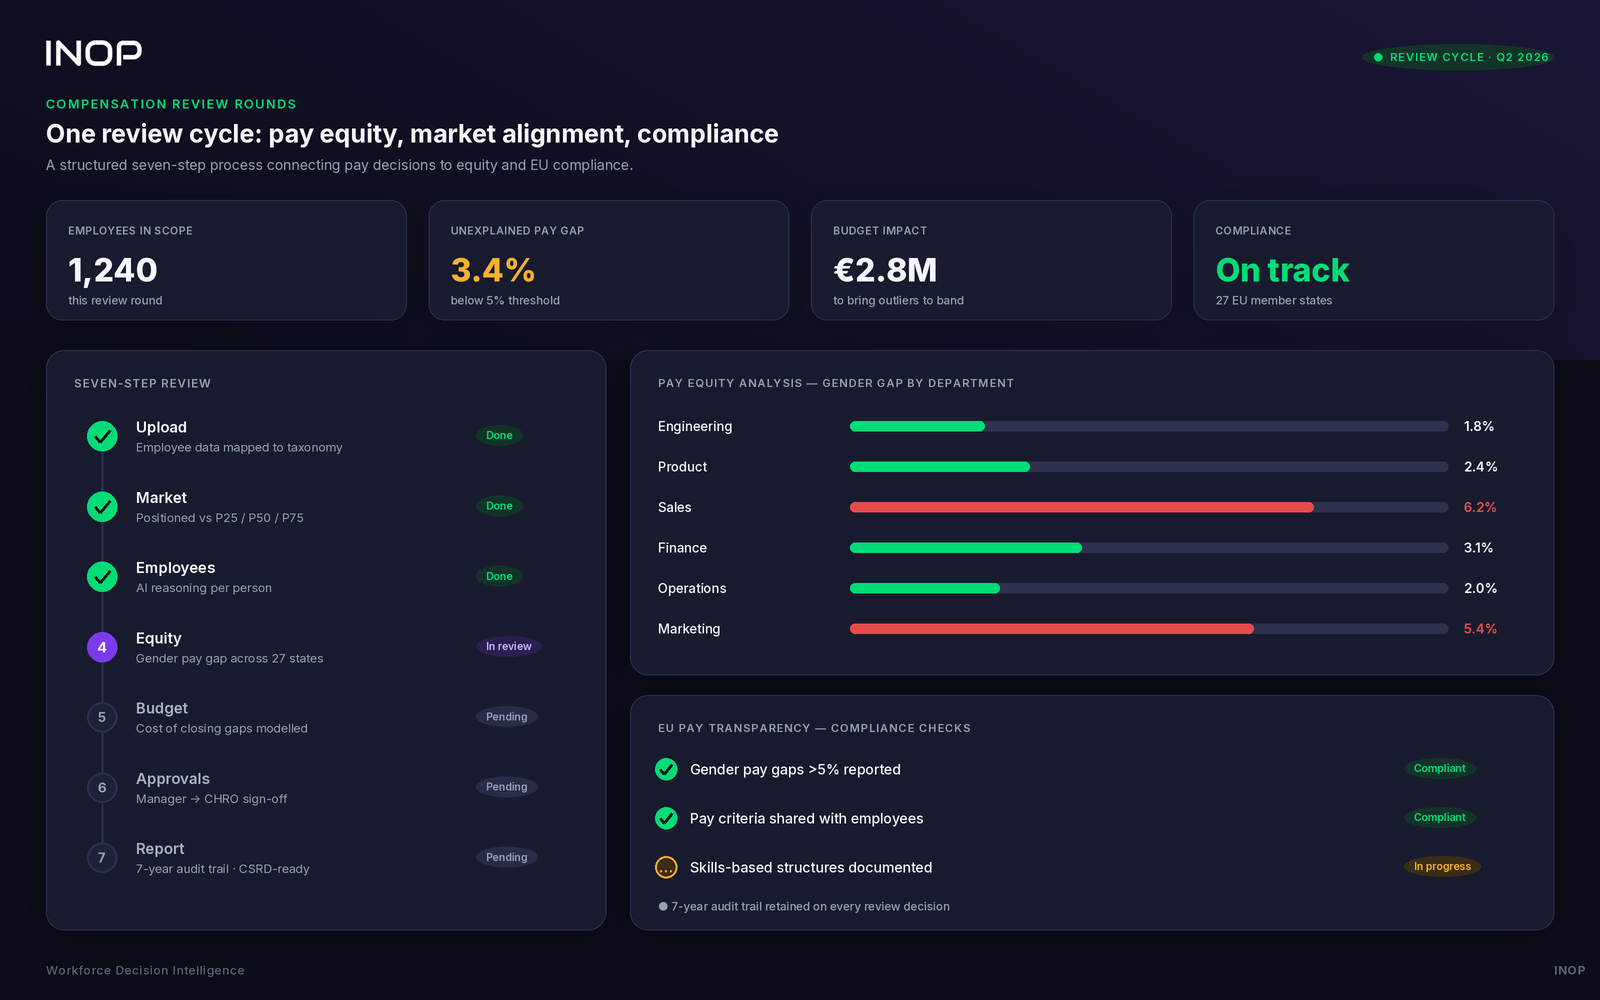
INOP's compensation analytics module guides HR teams and business leaders through a structured review cycle, from data collection to final approval, with pay equity checks, market alignment, and regulatory compliance built into every step.

1

Upload

Employee data uploaded and mapped to INOP's role taxonomy. Population defined per review cycle.

2

Market

Current pay positioned against P25, P50, P75 market benchmarks per role, level, and geography. Live data, not surveys from six months ago.

3

Employees

Employee-level review with AI reasoning per person. Managers see market context alongside each employee's current positioning.

4

Equity

Gender pay gap analysis across all 27 EU member states. Unexplained gaps flagged with statistical confidence. Audit-ready output.

5

Budget

Adjustment scenarios modelled: cost of closing gaps, cost of bringing outliers to band, and total compensation budget impact.

6

Approvals

Structured approval workflow: manager → senior approver → CHRO. Role-based access at every stage. No decision made without the right sign-off.

7

Report & employee communication

Final report with 7-year audit trail. Documented pay criteria ready to share with employees on request. Ready for regulatory submission, board reporting, and CSRD disclosure.

Skills-Based Pay

Reward what people can do, not what their job title says.

Two roles with identical titles can have completely different skill profiles and should command different compensation. INOP makes that distinction visible, market-validated, and defensible under EU Pay Transparency requirements.
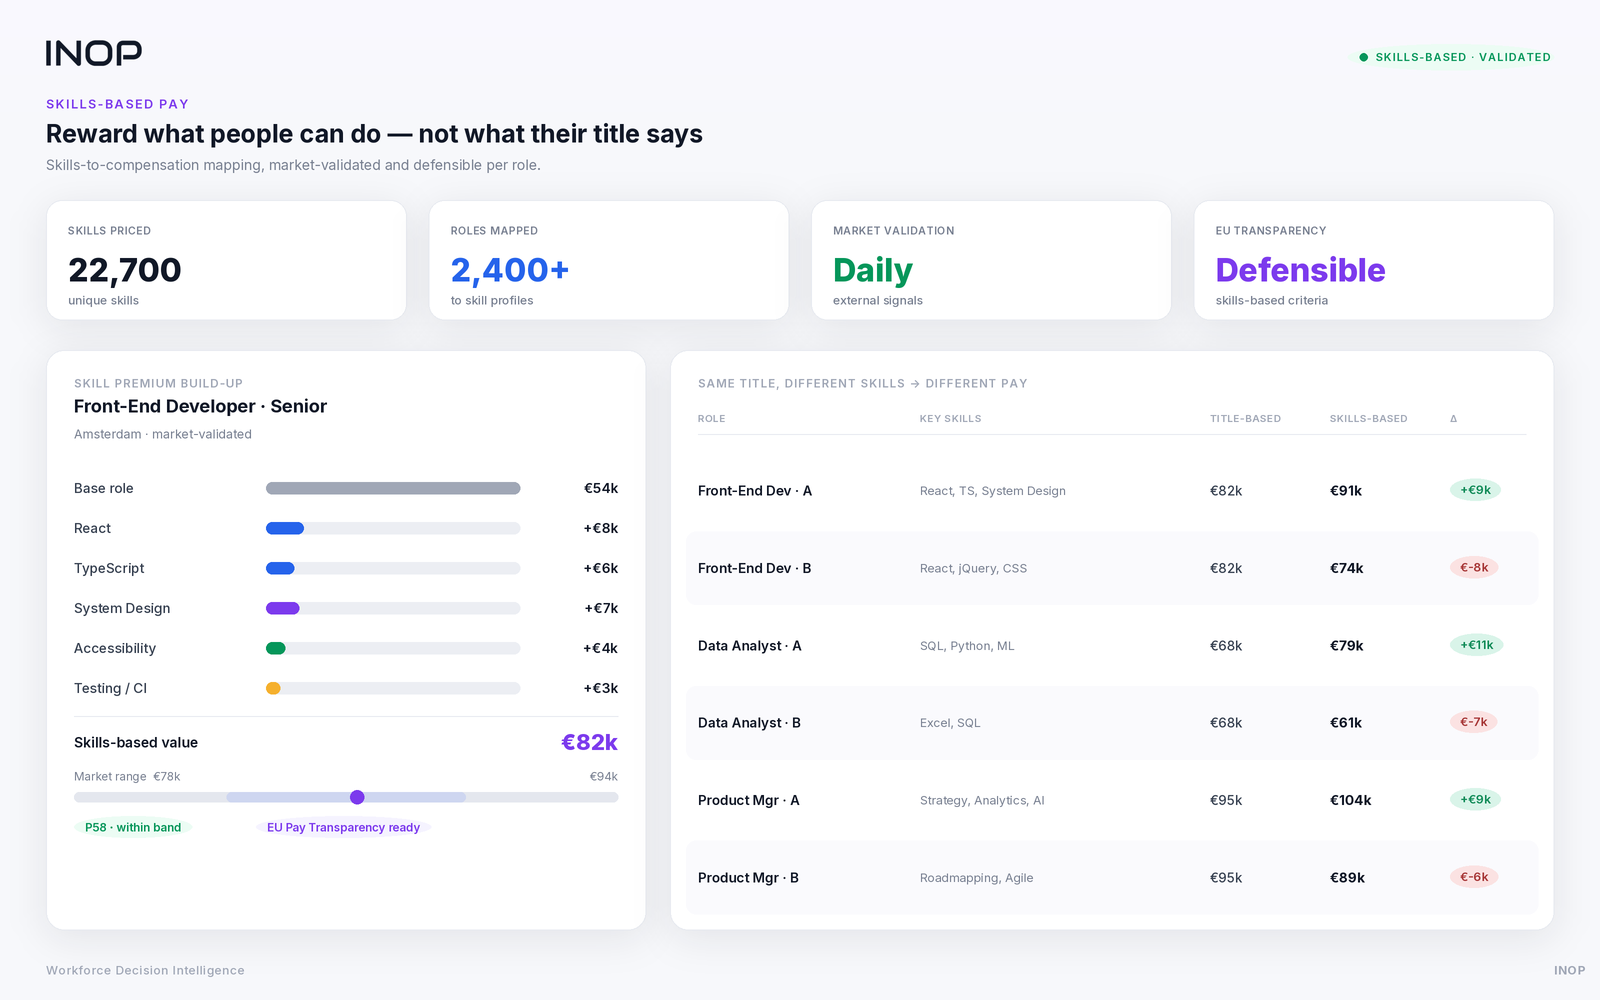
Skills-to-pay mapping Role-level differentiation Market-validated skills pricing EU Pay Transparency ready
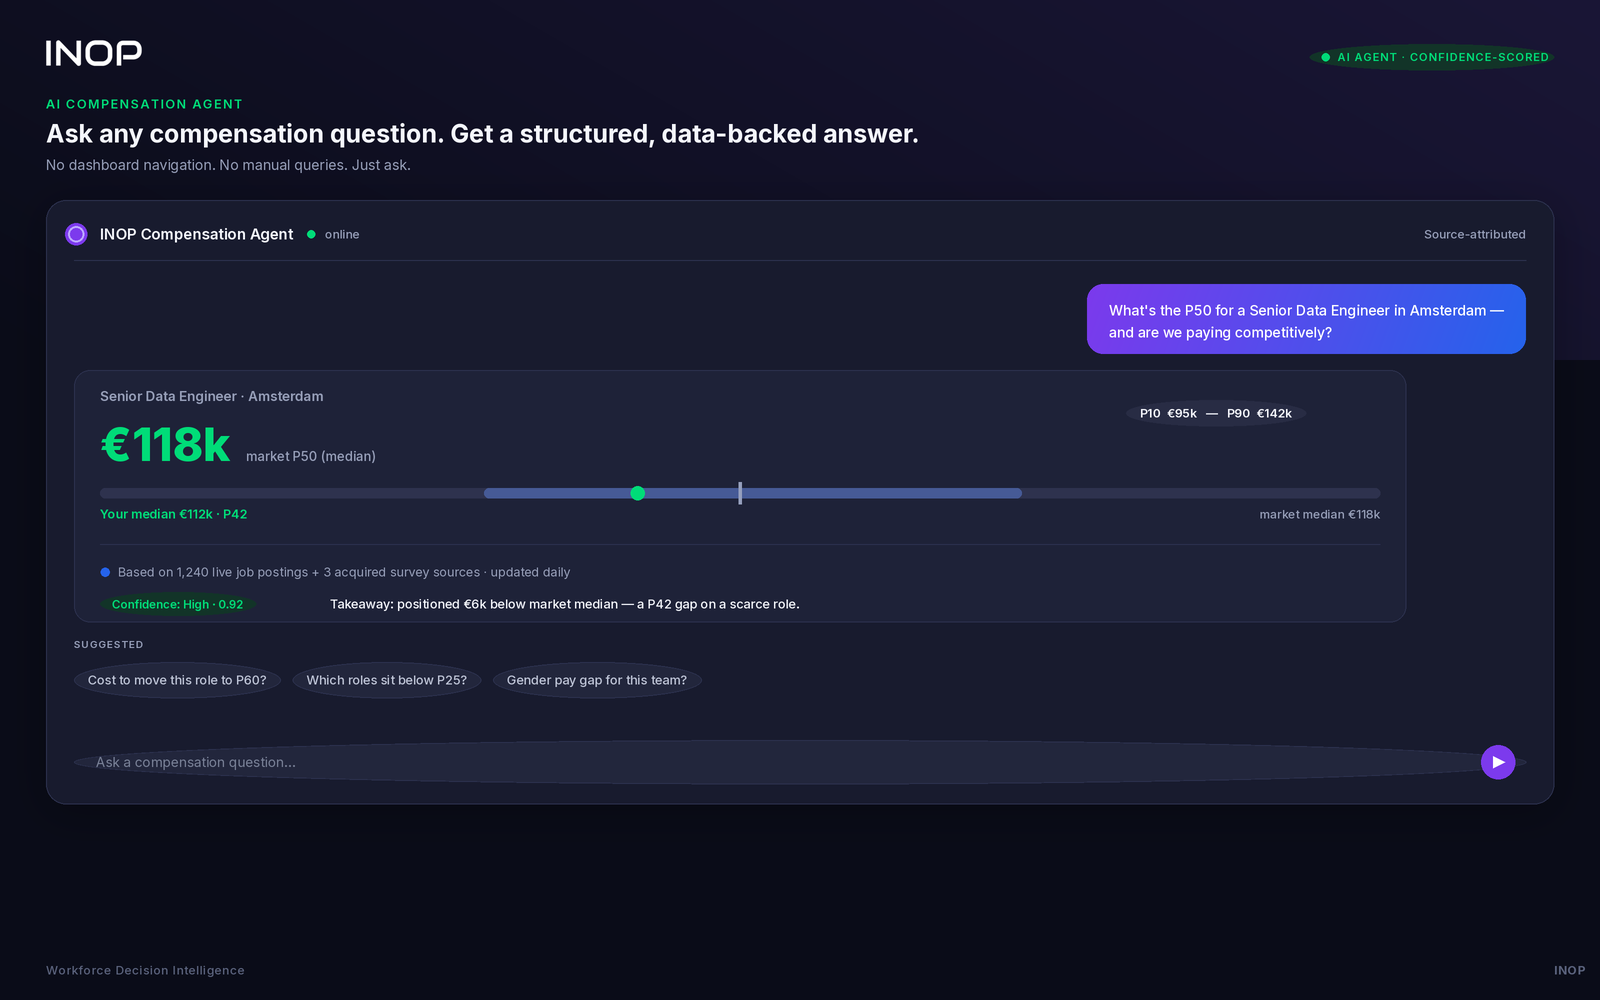
AI Compensation Agent

Ask any compensation question. Get a structured, data-backed answer.

No dashboard navigation. No manual queries. Just ask.

"What is the P50 for a Senior Data Engineer in Amsterdam?"

Instant benchmark with methodology, data sources, and confidence range.

"Which roles in our dataset are positioned below P25?"

Instant gap identification across uploaded workforce data, ranked by financial exposure.

"What would it cost to bring our engineering team to P75?"

Budget impact modelled instantly across affected roles and levels.

"Are we paying competitively for AI and ML skills in our sector?"

Skills-based benchmarking against external demand signals and peer organisations.

Coverage & workflow

The benchmark is already inside a decision. Not waiting in a report.

Your markets, your roles, your people, benchmarked against continuously updated data. Then actioned through a structured seven-step review process, not handed back as a report.

Europe &
North America
Core markets covered. Ask us about your specific geography.
2,400+
role profiles across industries and seniority levels
27
EU member states covered for pay equity and transparency compliance
Daily
job posting data updated continuously, not quarterly surveys

Sources include job boards, career platforms, salary platforms, published surveys, official labour department data, and acquired third-party datasets. Where data gaps exist, AI modelling is applied and clearly flagged. The benchmark is not the end product. It is embedded at every step of the review workflow, from market positioning through to board approval, already knowing the role, the skills, and the decision context it sits in.

Use case

In practice: German-based global tech company

Compensation benchmarking for scarce, senior technical and leadership roles

A growing MedTech company required a real-time view on compensation positioning for highly specialised leadership and senior technical roles. INOP delivered a benchmarking analysis combining sector-specific and cross-geographic market data, with transparent role mapping and robust statistical outputs to support executive-level decisions around scarce, critical roles.

🏭 MedTech sector 🌍 Multi-geography 👥 Senior & leadership roles ⚡ 48-hour turnaround
What clients say

From the people who use it.

"INOP delivered a responsive, high quality, thorough, and well-structured compensation benchmarking analysis, with clear transparency around data and assumptions, combining sector-specific insight with broader market context. The work was flexible, thoughtful, tailored, and supported strong executive-level recommendations."
Sonia Alison
Sonia Alison
Founder, Human Factor Health Check

"INOP provided a thoughtful, in-depth, and well-structured compensation benchmarking analysis, combining MedTech-specific insight with broader cross-sector and geographic market context, which helped us better understand positioning for highly specialised and scarce roles."

Dr. Wolfgang Wein
Dr. Wolfgang Wein
CEO, ImFusion GmbH
Get started

Ready to make smarter, fairer pay decisions?

Allocate compensation analytics where it creates the most value, and stay ahead of regulatory requirements.

FAQ

Common questions

We collect salary and compensation data from multiple complementary sources: job postings, job boards, career platforms, and salary platforms across industries and geographies, including user-reported salaries and employer-provided information; published surveys from leading consulting and recruitment firms; official labour department data from multiple countries; and acquired datasets from third-party compensation data providers. Where data gaps exist, we apply Generative AI techniques to model and infer missing values. These AI-estimated figures are clearly flagged within the platform and are used only to supplement, never replace, directly observed data.
Update frequency is calibrated to each source type. Job postings and job boards are harvested on a continuous, daily basis. Career platforms are refreshed quarterly, in line with their own update cycles. All other sources, including surveys, official labour data, and third-party datasets, are updated as new data becomes available. This layered approach ensures that our benchmarks reflect the market as it is today, not six months ago.
We currently hold rich datasets across Western Europe, including France, Germany, the Netherlands, Belgium, Portugal, Greece, Sweden, Denmark, and Romania; the British Isles, covering the United Kingdom and Ireland; North America, including the United States and Canada; and Asia, covering the Philippines and India. We cover all industries and job levels from junior through to senior. Our platform is underpinned by proprietary taxonomies: a Jobs Taxonomy of 2,400 roles and a Skills Taxonomy of 22,700 unique skills. For geographies outside our standard coverage, we operate a co-creation model with clients.
Our primary data storage is in Frankfurt, Germany (AWS), ensuring full EU data compliance by default. We also support multi-region storage for clients with specific business or regulatory requirements, and for those needing complete data sovereignty, on-premises or private cloud deployment is available. All data is encrypted in transit and at rest.
We are built to enterprise-grade security standards, certified under ISO 27001, ISO 27017 (Cloud Security), and SOC 2 Type II, and adhere to GDPR and CCPA. Our AI platform is aligned with the transparency and fairness principles of the EU AI Act: all models are fully documented with human-readable explanations; performance is continuously monitored and audited for fairness; and AI is decision-supportive throughout, with final decisions always made by human stakeholders.
INOP's compensation analytics module provides the evidence base for objective, skills-based pay structures, gender pay gap reporting across all 27 EU member states, and pay criteria documentation — the three core requirements of the Directive for companies with 100+ employees. The 7-year audit trail on all review decisions supports ongoing regulatory compliance.
Compensation is embedded into INOP's BBRA decision framework. Every Build, Buy, Redeploy, and Automate recommendation is priced using real-time benchmarks. When you benchmark a role in INOP, the market data already knows what skills that role requires, how critical it is to your strategy, and what action makes most sense. You go from benchmark to decision in one workflow — not from a report to a spreadsheet to a meeting.
INOP's compensation review module guides HR teams and business leaders through a structured 7-step review cycle — from data collection to final approval — with pay equity checks, market alignment, and regulatory compliance built into every step. The process covers upload, market benchmarking, employee-level review, equity analysis, budget modelling, structured approvals, and final reporting with a 7-year audit trail.
Skills-based pay rewards employees for what they can do rather than what their job title says. Two roles with identical titles can have completely different skill profiles and should command different compensation. INOP makes that distinction visible, market-validated, and defensible under EU Pay Transparency requirements — aligning compensation to real-world competencies through verified skills and market data.
Yes. INOP's AI Compensation Agent lets you ask any compensation question in plain language and receive a structured, data-backed answer. For example: "What is the P50 for a Senior Data Engineer in Amsterdam?", "Which roles in our dataset are positioned below P25?", or "What would it cost to bring our engineering team to P75?" — all answered instantly with methodology, data sources, and confidence ranges included.