
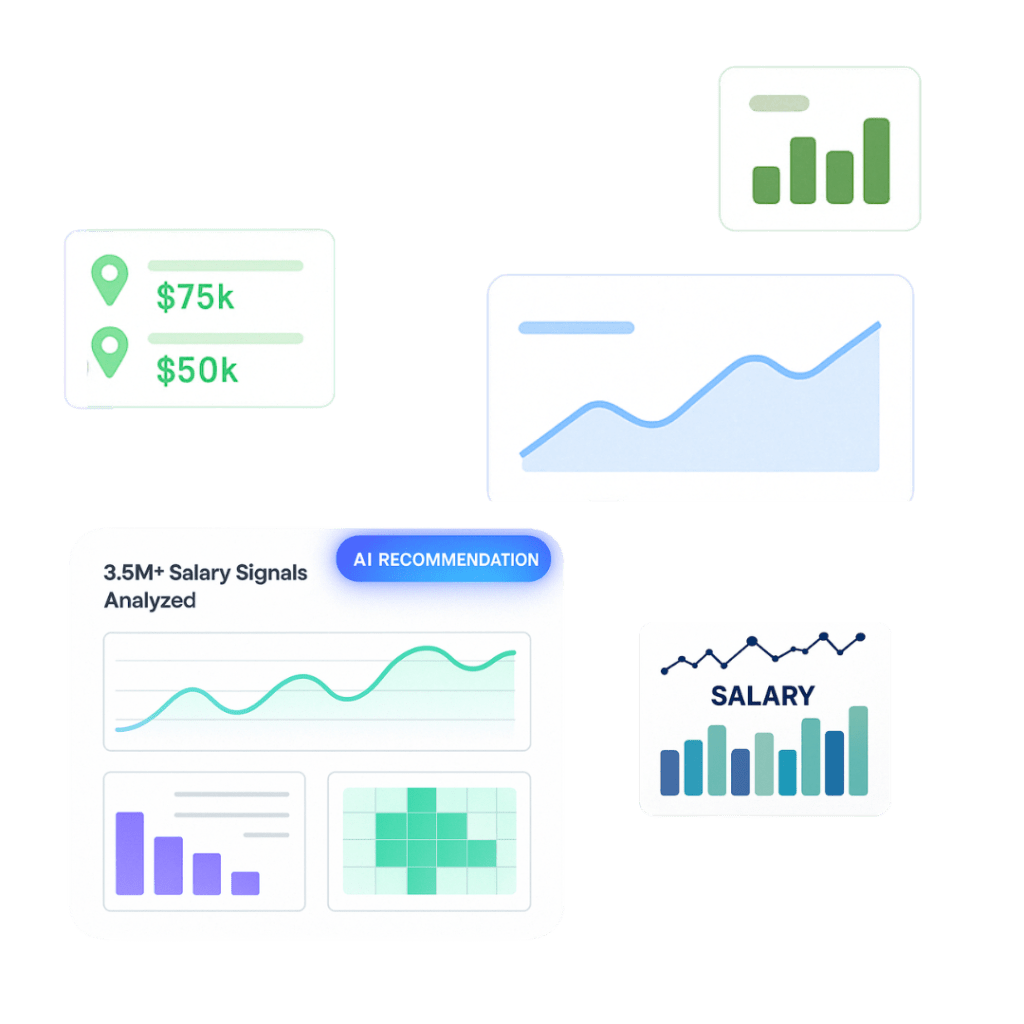
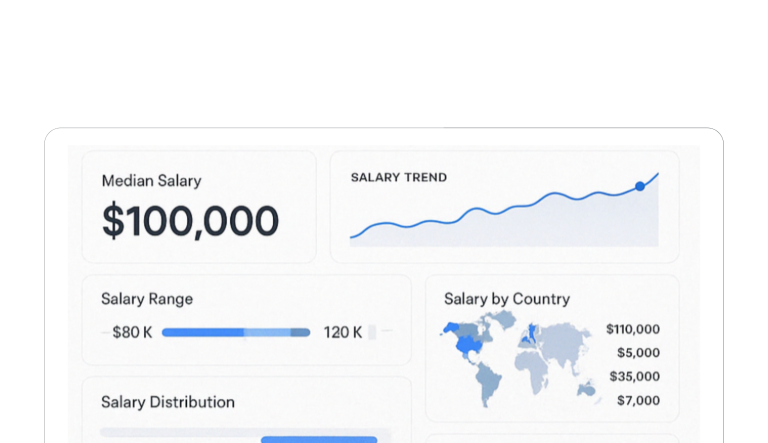
Market Compensation Insights
Access real-time global salary data across 16 countries, industries, and company sizes.
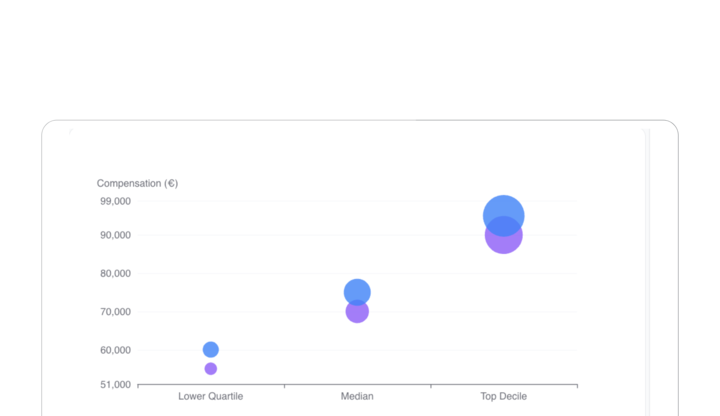
Salary Benchmarking and Negotiation
Compare against market competitors and make informed about any pay decisions
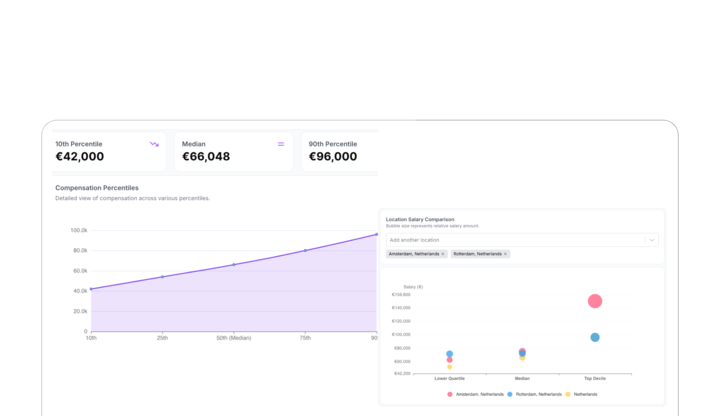
Pay Equity & Transparency
Spot pay gaps, ensure fairness, and stay compliant with emerging regulations like the EU Pay Transparency Directive


INOP delivered a responsive, high quality, thorough, and well-structured compensation benchmarking analysis, with clear transparency around data and assumptions, combining sector-specific insight with broader market context. The work was flexible, thoughtful, tailored, and supported strong executive-level recommendations.
Sonia Alison
Founder of Human Factor Health Check
“INOP provided a thoughtful, in-depth, and well-structured compensation benchmarking analysis, combining MedTech-specific insight with broader cross-sector and geographic market context, which helped us better understand positioning for highly specialized and scarce roles.”

Dr. Wolfgang Wein
CEO, ImFusion GmbH - MedTech Sector