Headcount planning is the process of forecasting how many people an organization needs, in which roles, at what fully loaded cost, and by when, and reconciling that forecast against the available budget before hiring runs ahead of it or lags behind it. People costs typically represent 60 to 70% of operating expenses. Headcount planning is the discipline that keeps that line under control without breaking the organization’s delivery capacity.
This guide covers what headcount planning actually involves, the five-step process that keeps HR and Finance working from the same numbers, how to structure a plan at the role level rather than the headcount-number level, the governance model that prevents the approval bottleneck, the tools available to run it, how to close a headcount gap without defaulting straight to external hiring, and the KPIs that show whether the plan is working month by month.
Want to see headcount planning connected to skills intelligence and financial scenario modeling? Book a 20-minute demo with INOP.
What Is Headcount Planning?
Headcount planning forecasts the number, cost, and timing of roles needed to deliver a business plan, and reconciles that forecast against the available budget before any hiring happens. A well-built headcount plan is a live, driver-based model tied to the operating plan. The version most organizations run is an annual spreadsheet exercise that is already wrong by the first quarterly review, because it was built on last year’s org chart with a percentage adjustment rather than on this year’s business drivers.
The distinction matters financially. According to Planful’s 2025 Global Finance Survey, Finance reports moderate to high involvement in workforce planning at a large majority of organizations. Involvement is not the same as alignment. Finance and HR are frequently involved in the same planning process while working from different numbers on different update schedules, producing the quiet variance that becomes a painful budget reconciliation at year-end.
Headcount Planning vs Workforce Planning
Headcount planning is the more finance-centric core discipline: the number and fully loaded cost of roles over time. Workforce planning is a broader strategic process that encompasses organizational design, skills architecture, and long-term capability development. Finance typically leads headcount planning while HR leads the wider workforce strategy, but both should work from a single shared data set rather than two independently maintained models that drift apart between reporting cycles.
FTE vs Headcount: A Definition Problem That Breaks Plans
Siloed data and inconsistent definitions, specifically FTE versus headcount and gross versus net hiring figures, prevent accurate joins between HR and Finance models and are one of the most common reasons headcount plans and actual staffing diverge. Establish shared definitions before building the model. One FTE is one full-time equivalent, which may equal one employee or may be a composite of part-time workers. Headcount is the raw number of individuals. Gross hiring is total new hires. Net hiring accounts for attrition. Each team defaulting to the metric that fits its own reporting system without agreeing on a common definition produces a reconciliation problem that gets discovered at the quarterly review rather than at the design stage.
The Five-Step Headcount Planning Process
A robust headcount planning process keeps hiring demand-led rather than wish-led, and keeps Finance and HR reconciled on the same numbers throughout the year rather than only at the annual budget cycle.
Step 1: Translate Business Drivers Into Role Requirements
Start from the operating plan, not the org chart. Translate revenue targets, production volume plans, and customer acquisition assumptions into the specific roles required to hit them, rather than starting from last year’s headcount and adjusting up or down by a flat percentage. A plan that starts from the org chart reproduces whatever staffing pattern already exists, gaps and inefficiencies included.
For each business unit, the translation requires a driver ratio: how many additional roles does each unit of business output require? A sales organization that historically closes $1.2 million per account executive and is projecting $24 million in new revenue needs approximately 20 additional AE hires, modeled against realistic ramp time and quota achievement timelines. A manufacturing line adding a second shift needs the specific technician certifications that shift requires, not a generic headcount number that Finance and Operations will disagree about for the next six months.
Step 2: Build the Plan at Role Level, Not Headcount Level
Saying “we’re hiring 20 people in Q3” is a target, not a plan. A plan that Finance will approve and Recruiting can execute defines title, level, department, reporting line, anticipated start date, compensation band, and priority for every role. Without this detail, Recruiting cannot source, Finance cannot model cash flow, and leadership has no basis for trade-off decisions when budget tightens.
Role-level detail also prevents the approval mismatch that derails most mid-year headcount requests. When a VP requests three additional engineers in June without a corresponding role-level spec, Finance and HR each interpret the request differently, the approval cycle extends two months, and the hire date slips to Q4. When the role-level details are in the plan from the start, the approval is against a specific defined role rather than an abstract number.
Step 3: Model Fully Loaded Cost, Not Base Salary
Every role in the plan should carry its full cost: base salary plus employer taxes, benefits, equity, bonus, and allocated overhead. Plans built on base salary alone consistently understate true cost by 25 to 40%, and that gap compounds across dozens of open roles. When the first quarterly actual comes in higher than budgeted, Finance loses confidence in the model, and that confidence is difficult to rebuild within the same planning cycle.
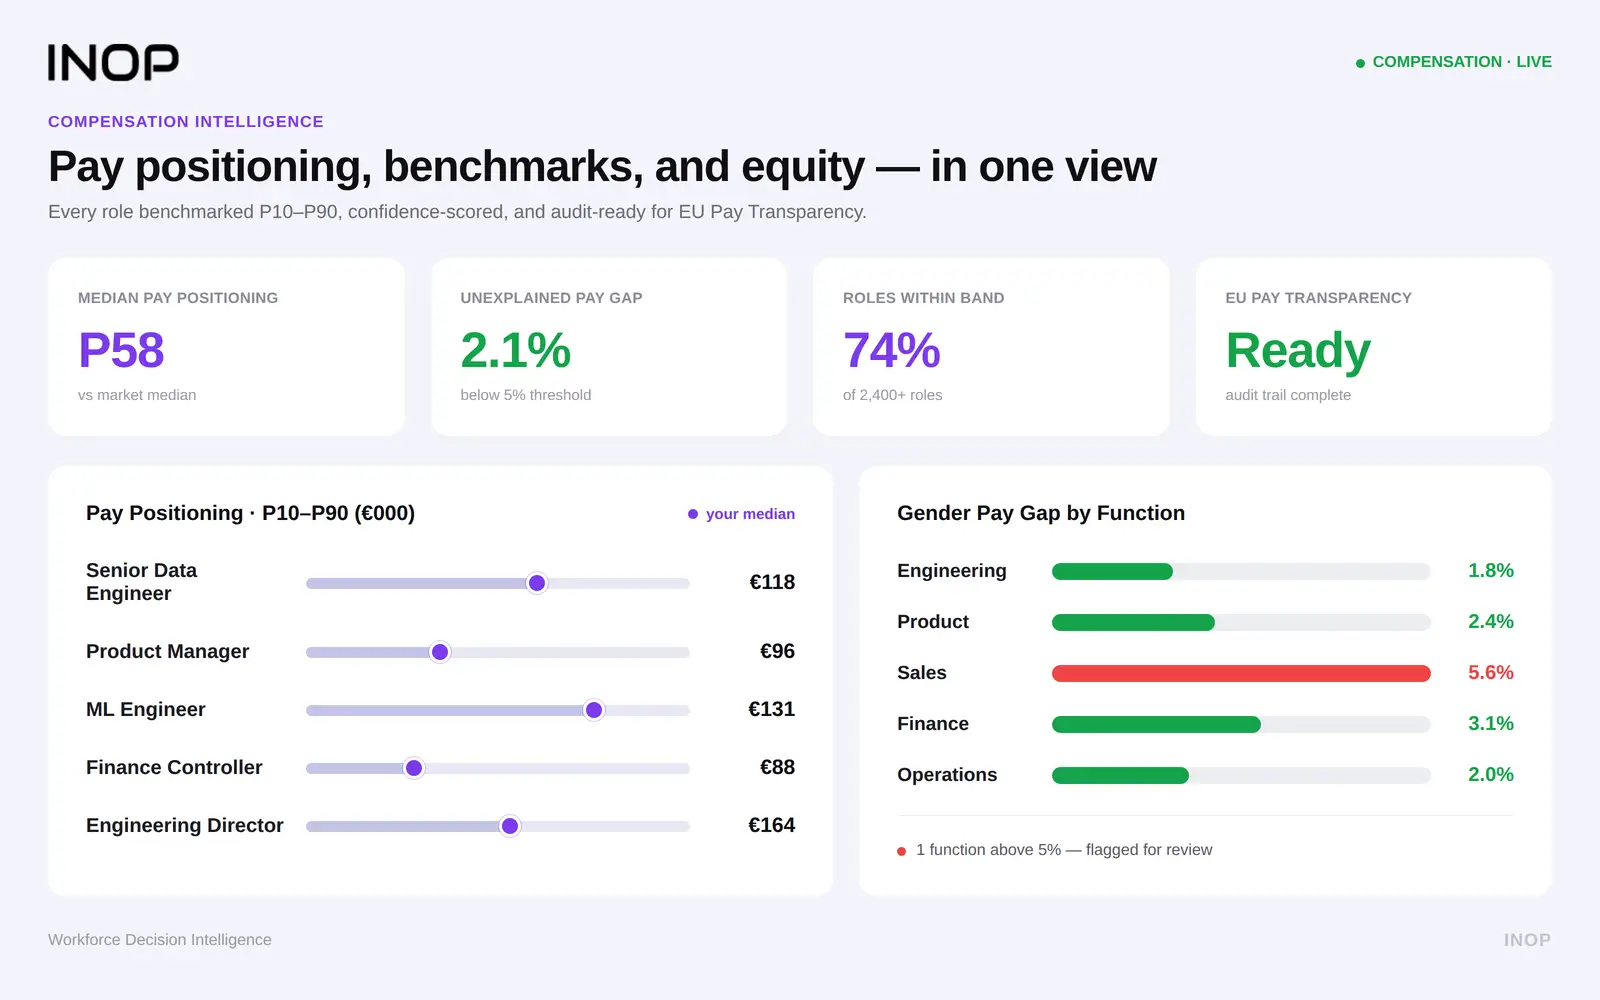
For organizations that need current market benchmarks to model accurate compensation by role and level, INOP’s compensation analytics platform draws on real-time market data rather than annual survey benchmarks, so the fully loaded cost figure in the headcount plan reflects the current market rate, not the rate from 14 months ago.
Step 4: Build Demand and Supply Scenarios Together
Demand tells you how many roles the business needs. Supply tells you how many you will have without new hiring, accounting for attrition, internal mobility, and pipeline already in progress. Building these separately and comparing them only at the end hides where the gap is coming from. Building them side by side surfaces it early enough to act on, and specifically enough to evaluate whether the gap response is a hire, a reskill, a redeploy, or an automation.
Run three scenarios: a base case that reflects current trajectory, a downside case that models 60 to 70% of the base growth assumption, and an upside case that models accelerated execution. Each scenario produces different headcount and cost implications. Having all three ready before Finance asks is the difference between a planning function that drives conversations and one that reacts to them.
Step 5: Phase Hires Across the Year and Review Monthly
Reflect realistic start dates and ramp time in the cost plan rather than modeling every hire as a January step-change. A new hire reaching full productivity in month four, not month one, changes both the cost timing and the capacity projection meaningfully. A plan that ignores ramp time overstates delivery capacity in the first two quarters of any hiring wave and consistently surprises the business when fully-staffed teams do not immediately produce at the expected rate.
The best organizations run a rolling headcount budget that updates monthly rather than a static annual plan. This allows Finance to see cost implications of headcount decisions in real time and enables course correction before variances become material. Budget reconciliation meetings between HR and Finance should happen quarterly at minimum, and monthly in high-growth or high-volatility environments.
The Headcount Plan Template: What to Include at the Role Level
A headcount plan that Finance will approve and Recruiting can execute requires more than a number by department. Each planned role should document seven fields before it enters the approval workflow.
Role title and level. The specific title and career level, senior engineer versus staff engineer versus principal engineer, for example, not just a function label. This determines the compensation band, the sourcing strategy, and the approval authority.
Department and reporting line. The business unit and the hiring manager. This prevents the common situation where a role is approved at the finance review without a clear owner, then sits in a queue for six weeks while HR determines who is accountable for the hiring decision.
Target start date and hire date. The target start date the business needs and the required offer date that precedes it, accounting for your average time-to-fill for that role family. A role the business needs filled on 1 September with a 12-week average time-to-fill needs an offer by mid-June and a sourcing start no later than early May. Most headcount plans do not trace this backward, which is why Q3 roles consistently open in Q3 rather than being sourced in Q1.
Priority tier. Critical (the business plan breaks without this hire), high (execution is materially affected), or standard (useful but not on the critical path). Priority tiers give Finance and HR a shared framework for making trade-off decisions when budget tightens mid-year rather than arguing about individual roles in isolation.
Fully loaded annual cost. Base salary midpoint for the role’s level and market, plus employer taxes, benefits, equity, and overhead allocation. Use your current compensation benchmark data, not the band that was set two years ago, for roles in market segments where pay has moved.
Business case anchor. The specific business driver or objective this role serves: the product launch it enables, the revenue line it supports, the compliance requirement it satisfies. One sentence. Finance uses this to evaluate trade-offs when headcount requests exceed budget, and it converts a headcount request into a business investment with a stated purpose.
Gap closure pathway. The evaluation of Build, Buy, Redeploy, and Automate before the role enters the external hiring process. This field is the most consistently skipped, and skipping it is where headcount plans become the most expensive version of themselves.
Headcount Planning Governance: Who Owns Which Decision
A headcount plan that has no governance model produces the most common planning failure mode: Finance approves an annual budget, departments submit mid-year add requests outside the plan, HR fields requests without a consistent framework for evaluating them, and the gap between budgeted and actual headcount grows silently through the year until a forced reconciliation at Q3 budget review.
The Headcount Committee
Organizations that run headcount planning well typically establish a formal headcount committee, or at minimum a documented approval workflow, that sits above the individual manager hiring request. The committee meets monthly, reviews all open requisitions against the plan, evaluates mid-cycle add requests against the business case anchor, and makes explicit trade-off decisions when requests exceed available budget.
When this committee functions well, the question “did Finance approve that headcount?” stops being a source of friction between HR and Finance because both teams attend the same meeting, see the same pipeline, and make decisions together rather than through sequential approval chains that allow Finance and HR to make different assumptions about the same role.
Role and Responsibility Mapping
Mihcm’s 2026 workforce planning guide identifies four roles in a functioning headcount governance model. The HR Business Partner translates business needs into people actions and validates planning assumptions. The people analytics or workforce planning team builds the models and dashboards, owns forecast accuracy, and runs scenario analysis. The workforce planner operationalizes hiring, redeployment, and contractor strategies. The finance partner aligns headcount forecasts to the P&L and capital plans and approves trade-offs.
The failure mode is when these four roles overlap without clear ownership boundaries, producing situations where Finance and HR both believe the other has approved a headcount decision, or where model maintenance has no named owner and forecasts drift when no one recalibrates the parameters.
Closing Headcount Gaps: Build, Buy, Redeploy, or Automate
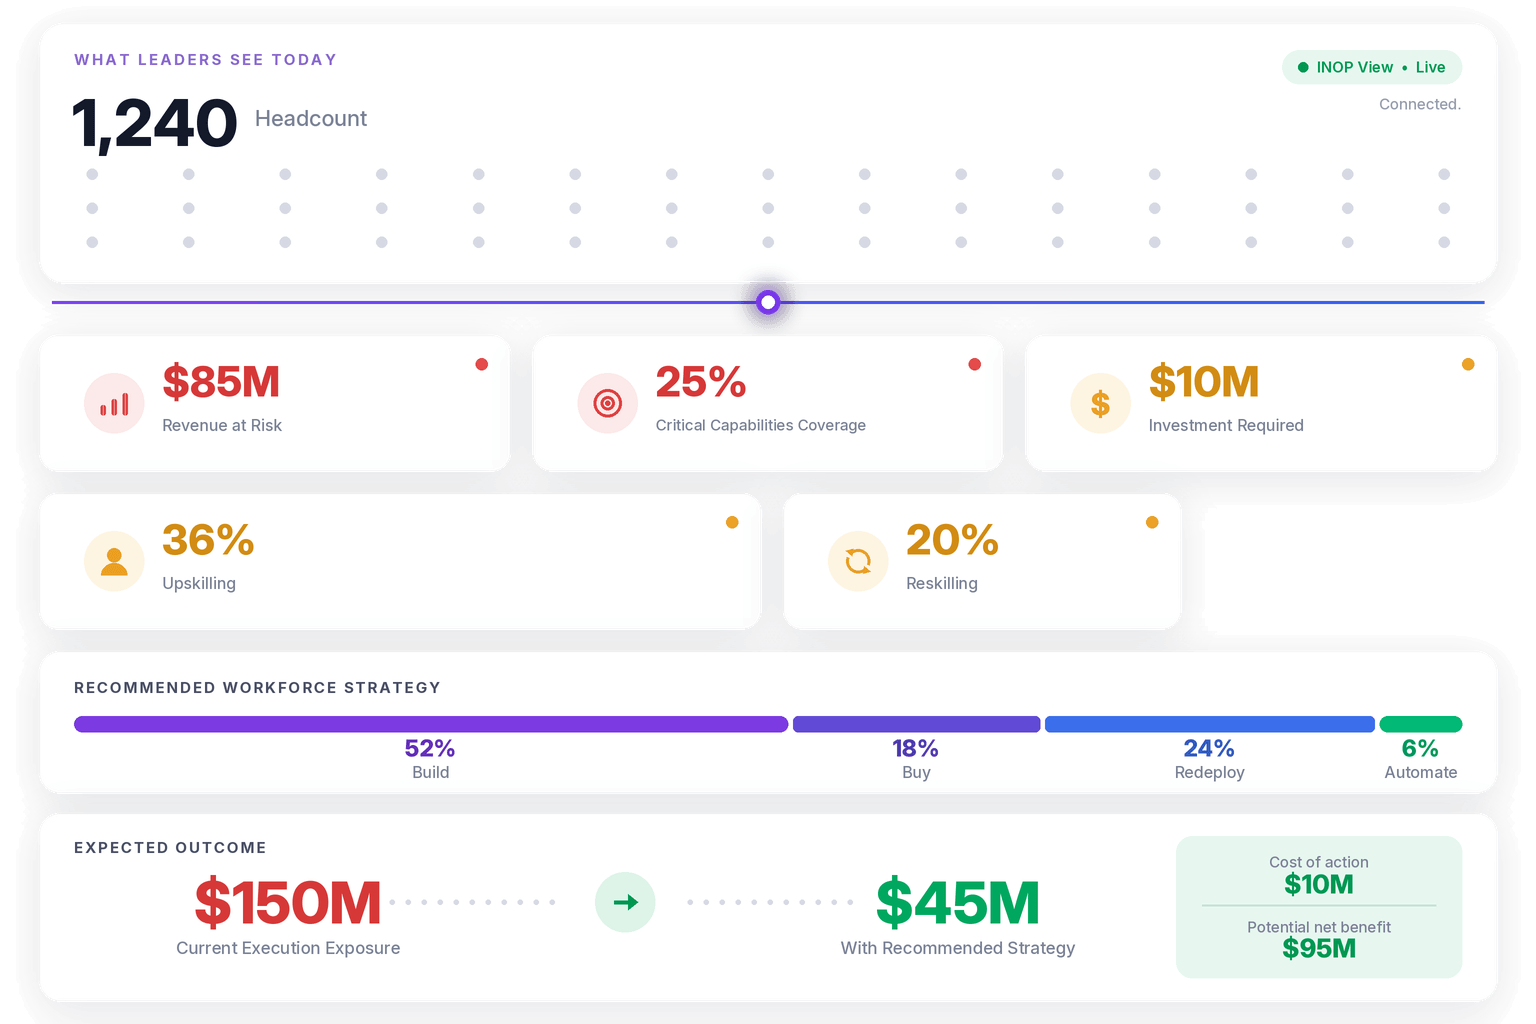
A headcount gap identified through planning can close more than one way. Treating external hiring as the automatic default is where headcount plans become the most expensive version of themselves. INOP evaluates every identified gap through the Build, Buy, Redeploy, Automate framework, INOP’s proprietary BBRA decision architecture, which models the financial trade-off of each pathway across 30-day, 180-day, one-year, and three-year horizons rather than routing every gap straight to a requisition.
Build develops the capability internally through training, stretch assignments, or structured reskilling. The evaluation question is whether the required proficiency level can be developed within the timeline the business needs it. A cloud architecture gap that needs to be closed in four months cannot be built in four months. The same gap on an 18-month timeline usually can be, at lower total cost than external hiring and with higher retention probability because the employee experiences the development as a career investment.
Buy acquires the capability through external hiring. The cost evaluation should include time-to-fill for this role family in this geography, the ramp period before the hire reaches full productivity, the agency or recruiter fee if applicable, and the compensation cost. These four figures together almost always produce a higher number than the base salary figure that initially appears in the headcount plan.
Redeploy moves an internal employee with adjacent skills into the gap. This pathway closes gaps faster and at lower cost than external search for roles where ramp time on an external hire is long, because the redeployed employee already understands the organization, the context, and the systems. It requires a verified skills inventory to identify who has the adjacent capability. INOP’s skills intelligence platform maps verified internal capability against external market demand signals so the redeploy pathway in a headcount decision is grounded in evidence rather than a manager’s estimate about who might be able to step in.
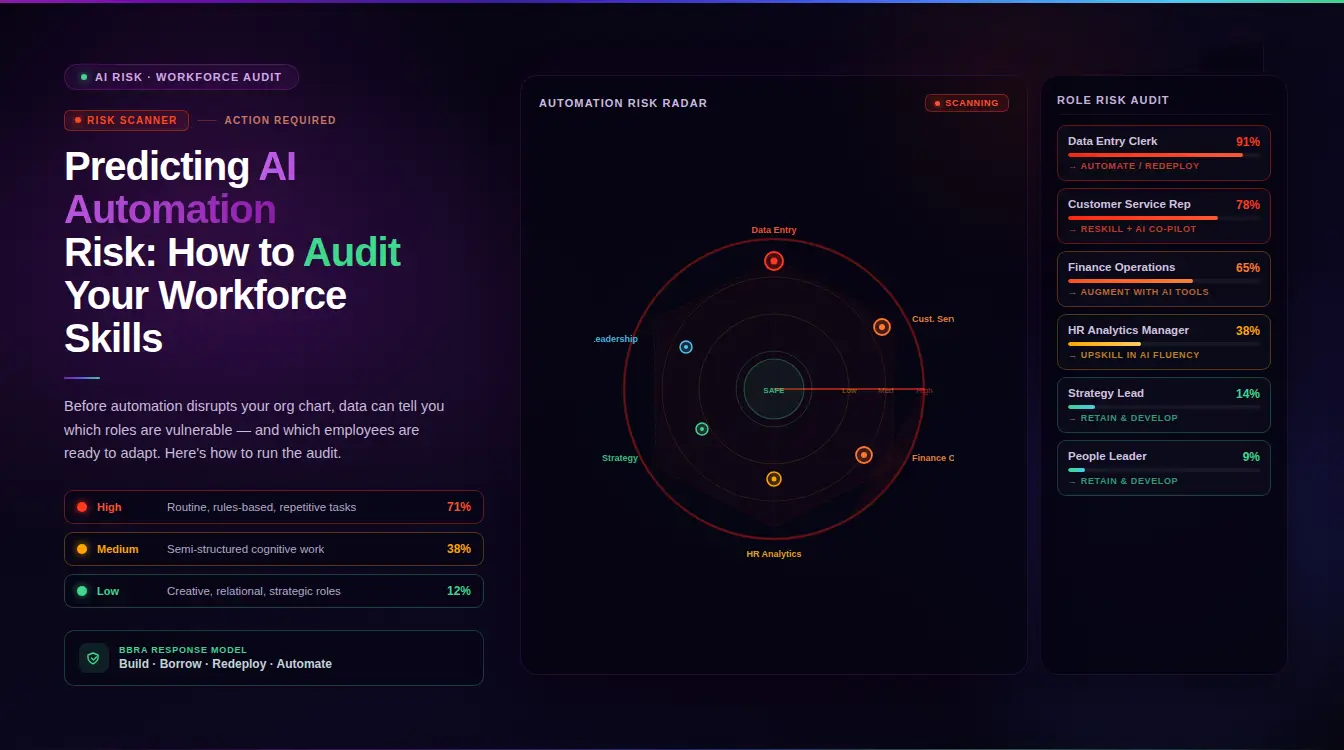
Automate evaluates whether the work can be handled by AI tools or process automation, removing the human capacity requirement. McKinsey’s 2025 Generative AI research found that 28% of routine knowledge tasks are now automatable. For certain functions, a headcount target of 100 can be delivered with 75 to 80 people plus appropriate tooling. Organizations that exclude automation from the gap closure evaluation are leaving real cost savings off the table while their competitors capture them.
The sequencing matters. Evaluating redeploy and reskilling before external hiring, using the same rigor a hiring decision would receive, closes gaps faster and at lower cost for a meaningful share of roles, particularly where ramp time on external hires is long.
The discipline of continuously applying this BBRA evaluation before defaulting to external hiring, not just at annual planning but whenever a gap is identified, is what distinguishes headcount planning from workforce optimization. Planning answers whether you have enough people on the right timeline. Optimization answers whether the people you have are deployed, developed, and incentivized to produce what the business plan requires right now.
See how a headcount gap gets evaluated across all four pathways. Book a demo to walk through INOP’s approach with your own role types.
Headcount Planning Tools: A Tiered Comparison for 2026
| Tool | Best For | Core Strength |
|---|---|---|
| Anaplan | Enterprise, cross-functional financial modeling | Highly configurable driver-based headcount and cost modeling |
| Workday Adaptive Planning | Finance-led headcount planning on Workday HCM | Tight integration between HCM and financial planning; changes flow automatically |
| Planful | Mid-market FP&A and HR collaboration | Shared workflows and dashboards across Finance and HR; rolling forecast support |
| ChartHop | Org design paired with headcount planning | Visual org chart tied directly to headcount scenarios; strong for reorg situations |
| Leapsome | HR-led planning with performance and engagement data connected | Single source of truth for roles, budgets, and real-time people data across Finance, HR, and managers |
| Pave | Compensation benchmarking within the headcount plan | Real-time market pay data for band-setting; prevents undercosting roles at plan stage |
| INOP | Headcount planning connected to skills intelligence and BBRA decision modeling | Connects gap closure decisions to verified internal capability data and real-time market benchmarks; serves CHROs, CFOs, and PE operating partners |
Finance-Led Platforms
Anaplan and Workday Adaptive Planning both serve organizations that want headcount planning built as a true extension of the financial model, where a revenue assumption change flows automatically into headcount cost projections rather than requiring a manual update in a separate HR spreadsheet. Both require meaningful setup investment and modeling expertise. They fit larger organizations with a dedicated FP&A function better than lean teams that need something usable in weeks rather than quarters.
HR and Workforce-Led Platforms
Planful and ChartHop make headcount planning collaborative between HR and Finance rather than something Finance builds and HR reacts to. ChartHop’s org-chart-first interface is particularly useful when a headcount decision has org design implications beyond a simple number, such as a reorg, a new reporting line, or a team split, that a flat spreadsheet row does not capture. Leapsome’s HRIS integration gives HR, Finance, and managers the same performance, goals, and headcount data in real time, which removes the “whose numbers are right” argument that erodes planning credibility faster than any model error.
Where INOP Fits
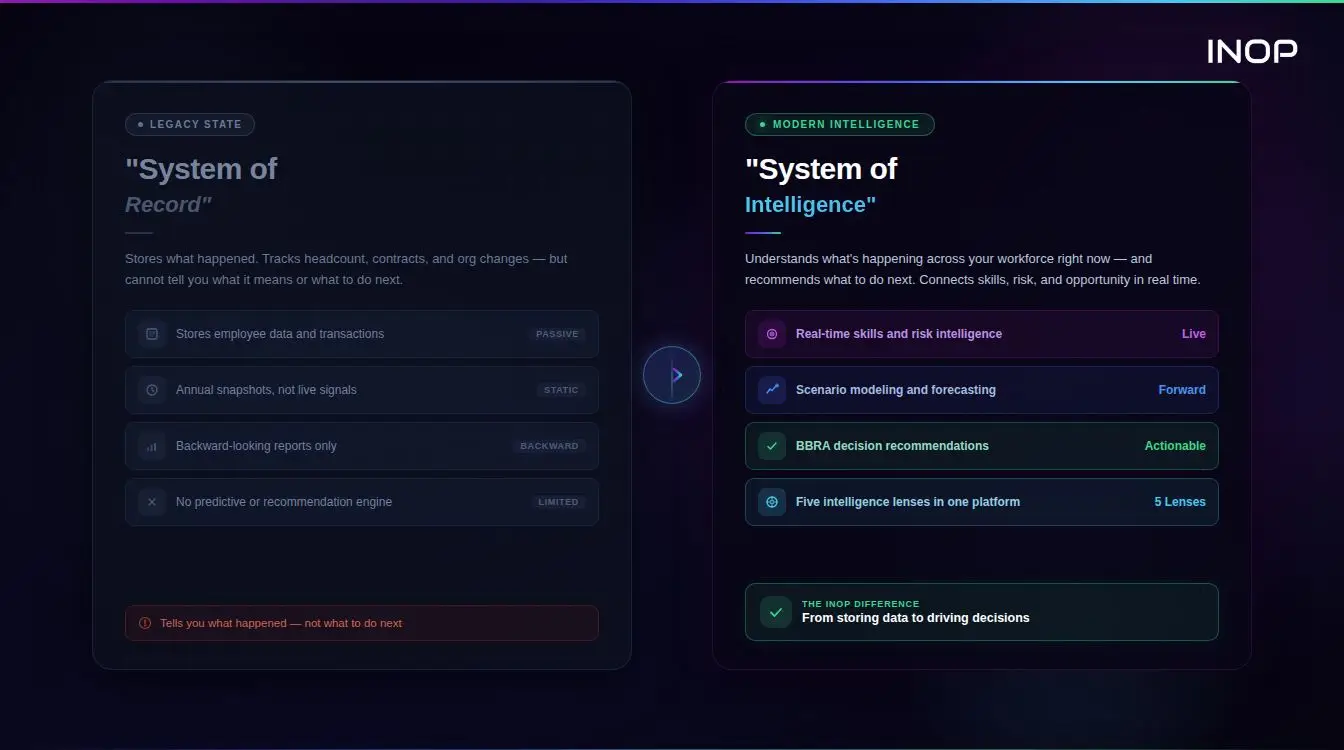
Most headcount planning tools handle the number and the cost. INOP’s strategic workforce planning platform handles the decision that follows: given this headcount gap, what is the right response, and what does each option cost across different time horizons? Every gap surfaced through headcount planning runs through INOP’s Workforce Risk Engine, which evaluates it against the BBRA framework and models the financial trade-off of each response pathway before a decision is made. Because redeployment is only a real option when you know who is qualified, INOP connects gap evaluation to a live skills inventory that Finance and HR can both interrogate.
Headcount Planning KPIs That Prove the Plan Is Working
Forecast Accuracy
Track planned headcount and cost against actuals every month, not just at year-end. A plan checked only at year-end cannot improve, and drift compounds silently until a budget review surfaces it all at once. Organizations with mature headcount planning practices report headcount cost forecast-to-budget variance below 5 to 7%. Organizations without structured planning report 15 to 25% variance, which produces the mid-period budget revisions that erode Finance’s confidence in HR-generated cost projections.
Time to Fill and Time to Productivity
Time to fill measures hiring velocity. Time to productivity measures how long until a new hire delivers at the level the plan assumed. Most headcount plans track the first and skip the second, but time to productivity is the metric that most directly explains why a fully staffed team is still missing its targets. A team of ten engineers that hired eight in Q1 but has six still in ramp period through Q2 is not a fully productive team. The headcount plan says it is.
Internal Fill Rate
The share of headcount gaps closed through internal redeployment rather than external hiring. This is the clearest single indicator of whether the BBRA evaluation is happening before a role gets posted externally, or whether it exists on paper but gets skipped under time pressure. Target 30% or above for organizations with a skills inventory in place. Below 15% in an organization of any scale suggests the redeploy pathway is not being evaluated before external posting.
Revenue per Head
Revenue divided by total headcount, tracked quarterly. This metric connects headcount planning to business productivity in the language Finance and boards use. When revenue per head declines while headcount grows, the plan is outrunning the business. When it holds or improves during a headcount increase, the plan is producing the intended leverage. It does not replace the other KPIs, but it is the one that most clearly signals whether headcount investment is producing proportionate business return.
Budget Variance
The gap between budgeted headcount cost and actual spend, tracked by department and role family rather than as a single company-wide number. A company-wide variance of 3% can hide a 20% overage in engineering and a 14% underspend in operations that cancel out in the aggregate. The department-level view is where Finance and HR have the specific information to act, not the consolidated number.
Cost per Role, Fully Loaded
Tracked against the plan’s original assumption, this catches cases where a role fills on plan at a cost materially different from what was budgeted. A VP of Engineering hired at $340,000 total compensation when the plan assumed $280,000 is a 21% cost variance on that role that a headcount-only view misses entirely. Catching these at the individual role level when the offer is made, rather than at the year-end actual, is the difference between a plan that corrects and one that accumulates.
Headcount Planning for Startups and High-Growth Companies
Headcount planning breaks down at growth-stage companies in a specific pattern. HR and Finance work from different data sources. Finance builds the hiring model in a spreadsheet, HR manages a separate org chart, and Recruiting tracks roles in the ATS. By the time the quarterly review arrives, all three have different headcount numbers for the same period and the first 40 minutes of the meeting establishes whose numbers to use rather than making decisions.
The fix for a 50 to 200 person company is not a sophisticated platform. It is one shared document with role-level detail that Finance, HR, and Recruiting all work from, updated weekly, with a named person responsible for each update. The discipline of role-level detail, with title, level, department, start date, and business case anchor for every planned hire, is achievable in a spreadsheet at this size and produces significantly better hiring execution than a headcount target that all three functions interpret differently.
Tie every hire to a revenue trigger or a business event rather than a calendar date. A hire tied to “close of Series B” or “first contract with $1M ARR customer” is easy to evaluate when conditions change. A hire tied to “Q3 start” is either made on schedule regardless of business conditions or deferred awkwardly when the external environment shifts. Revenue-triggered hiring dramatically reduces over-hiring risk during growth periods where the revenue projection and the actual trajectory diverge.
Headcount Planning for PE Portfolio Companies
Headcount planning carries a different weight for private equity operating partners. A 100-day plan built on a portfolio company’s existing headcount assumptions, without independently modeling fully loaded cost, ramp time, and realistic attrition by role family, is a plan built on inherited numbers rather than verified ones. Operating partners who rebuild the headcount model independently during diligence and early integration routinely find that budgeted and actual cost diverge more than pre-close reporting suggested.
Three specific modeling failures recur in PE portfolio headcount plans. The first is base salary planning without benefits and overhead, which understates true cost by 25 to 40%. The second is attrition modeling at blended company-wide rates rather than by role family, which misses the concentrated attrition risk in specific critical functions. The third is treating every gap as a hiring decision without evaluating the BBRA alternatives, which inflates external hiring spend on gaps that internal redeployment or automation could close faster and at lower cost within the hold period timeline.
The compounding effect across a portfolio is where the value is. A consistent headcount planning methodology applied across multiple portfolio companies lets operating partners compare cost trajectories and hiring discipline across entities on the same basis, informing integration sequencing and, ahead of an exit, building a defensible workforce cost narrative based on a single, auditable methodology rather than each portfolio company’s own historical reporting.
INOP’s strategic workforce planning platform supports operating partners in standardizing this methodology across the portfolio, connecting headcount plan outputs to skills gap analysis and BBRA-framed financial scenario modeling in a format that investment committees can interrogate directly. Book a demo to see how INOP builds headcount models across PE portfolio environments.
Ready to connect headcount planning to skills intelligence and financial scenario modeling? See INOP’s workforce planning platform in a 20-minute demo.
Common Headcount Planning Mistakes
Planning base salary instead of fully loaded cost. This understates true cost and erodes plan credibility once actuals arrive. Employer taxes, benefits, equity, and overhead typically add 25 to 40% above base salary. A 20-person hiring plan modeled on base salary produces a cost assumption that is $800,000 to $1.2 million below actual for a mid-market company at average salaries of $100,000.
Treating every gap as a hiring decision by default. Skipping the redeploy and automate evaluation means paying for external search and onboarding on gaps that internal capability or process automation could close faster and cheaper. The evaluation does not need to be lengthy. A five-minute structured assessment against the four BBRA pathways, with a documented rationale for the path taken, is enough to prevent the default behavior.
Running HR and Finance models separately. Two spreadsheets updated on different schedules by different teams produce the quiet variance that becomes a painful budget reconciliation. One shared model, with agreed definitions, updated by one named owner, is the structural fix.
No monthly checkpoint. An annual plan reviewed only at year-end cannot catch drift while it is still cheap to correct. Variance that surfaces at month two costs a schedule adjustment. The same variance surfacing at month ten costs a budget revision, a management escalation, and the planning function’s credibility with Finance for the next cycle.
Ignoring ramp time. Modeling new hires as fully productive from day one overstates near-term capacity. A team that hires six engineers in Q1 with a three-month ramp period is running at approximately 75% of its planned capacity through Q2. Plans that ignore this produce capacity projections that look fine on the model and disappoint in execution.
No named approval owner for mid-cycle add requests. Most headcount plans handle the annual cycle adequately. They break down when a department head requests an unplanned hire in month five. Without a documented approval process for mid-cycle requests, these requests route through informal channels and either get approved without budget evaluation or get stuck without a clear path to decision. Either outcome erodes plan integrity.
How INOP Connects Headcount Planning to Workforce Decision Intelligence
INOP connects headcount planning to the broader workforce decision it is actually part of, synthesized across five integrated intelligence lenses: Strategy, Finance, People, Market, and AI and Automation.
Every gap surfaced through headcount planning runs through INOP’s Strategic Workforce Planning platform, where the Workforce Risk Engine evaluates it against the BBRA framework and models the financial trade-off of each response pathway before a decision is made. Because fully loaded cost is central to an accurate headcount plan, gaps are also evaluated against INOP’s Compensation Analytics platform, which draws on current market compensation data so a redeployment or hiring recommendation reflects real cost rather than a stale internal band.
Redeployment is only a real option when you know who is qualified. INOP’s Skills Intelligence platform maps verified internal capability against external market demand signals so the redeploy pathway in a headcount decision uses evidence rather than a manager’s guess about who might step into the gap.
For organizations building the connection between headcount planning and skills-based workforce planning more broadly, INOP’s guide on modern workforce forecasting covers how driver-based demand modeling connects to skills supply analysis and scenario planning.
Headcount planning is the more finance-centric discipline: the number, cost, and timing of roles. Workforce planning is broader, covering skills, capability, and succession alongside headcount. In practice, Finance typically leads headcount planning while HR leads the wider workforce strategy, ideally from a shared data set.
Look for a platform that ties headcount decisions directly to the financial model, so a change in the hiring plan automatically reflects in budget projections rather than requiring a manual update in a separate system. INOP’s Strategic Workforce Planning platform connects headcount decisions to fully loaded cost data from Compensation Analytics, so Finance and HR are always working from the same numbers.
Most organizations benefit from a monthly checkpoint against actuals and a full quarterly replan, rather than reviewing only at the annual budget cycle. Fast-changing businesses or critical role families sometimes warrant more frequent review.
At minimum, current headcount and fully loaded cost by role, rolling attrition by role family, revenue or activity targets from Finance, and, ideally, a skills inventory so gaps can be evaluated for internal redeployment before defaulting to external hiring.
It gives operating partners a way to independently verify a portfolio company’s cost and staffing assumptions during diligence and integration, rather than inheriting pre-close reporting at face value, and a consistent methodology to compare headcount cost and hiring discipline across multiple portfolio companies on the same basis, supporting both integration planning and pre-exit workforce cost defensibility.
Finance and HR maintaining separate models on separate schedules. Once the two versions of the plan diverge, the gap tends to grow quietly until a budget review forces a reconciliation that’s far more painful than a monthly checkpoint would have been.
Make confident workforce decisions that support strategy and value creation.