Workforce forecasting is the process of predicting how many people you will need, in which roles, in which locations, and with which skills, over a defined future horizon, and comparing that against how many people you will actually have. Done well, it turns headcount planning from a reactive scramble into a repeatable, defensible process that HR, finance, and operations all trust. Done poorly, or not at all, it produces the pattern most organizations know too well: emergency hiring, budget surprises, and skill gaps discovered only after they have already cost the business a quarter of missed output.
This guide covers what workforce forecasting actually measures, the demand and supply models behind it, the quantitative methods used to build a forecast, how the leading tools compare, and how to roll out a forecasting process that survives contact with a real business cycle.
What Is Workforce Forecasting
Workforce forecasting predicts future labor needs by modeling two sides of an equation separately, demand and supply, then quantifying the gap between them. It is a quantitative discipline, built on historical data, business drivers, and statistical or machine learning models, rather than a manager’s gut sense of “we’ll probably need a few more people next quarter.”
Workforce Forecasting vs Workforce Planning
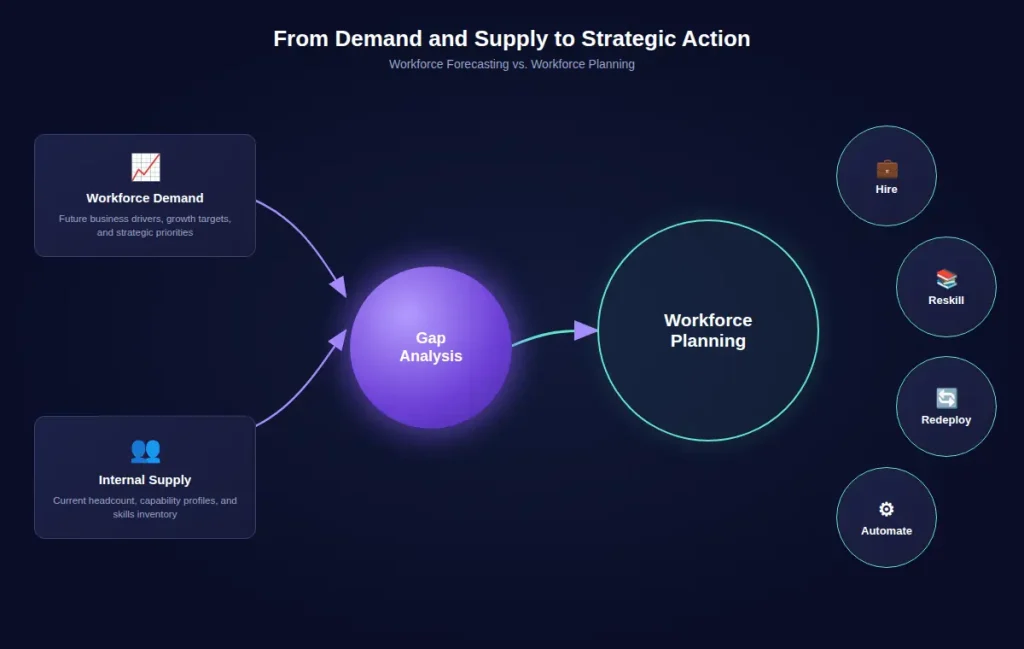
The two terms get used interchangeably, but they describe different layers of the same process. Workforce forecasting produces the numbers: how many people, in which roles, by which quarter. Workforce planning is the broader strategic process that takes those numbers and decides what to do about them, hire externally, redeploy internally, reskill, automate, or restructure. A forecast without a planning process attached to it is just a spreadsheet nobody acts on. A planning process without a rigorous forecast underneath it is strategy built on guesswork.
Labor Forecasting and Workforce Forecasting Are Not the Same Thing
Labor forecasting is frequently used as a synonym for workforce forecasting, but in practice it usually refers to something narrower: predicting hourly labor demand for scheduling purposes, shift coverage in retail, call center staffing by fifteen-minute interval, warehouse headcount by peak season. Labor forecasting operates on a short horizon, days to weeks, and feeds directly into scheduling software. Workforce forecasting operates on a longer horizon, typically one to three years, and feeds into budget cycles, hiring plans, and strategic workforce decisions. Organizations that need both should expect to use different tools for each: a labor forecasting or workforce management platform for shift-level scheduling, and a strategic workforce forecasting capability for the longer-range headcount and skills picture.
Workforce Forecasting Benchmarks: What Good Looks Like
Before building a forecasting programme, it helps to understand what mature forecasting performance looks like and how far most organizations currently are from it.
Only 28% of HR leaders believe their current workforce plan would survive contact with a major business shock, according to McKinsey’s 2025 Workforce Planning Index. That figure means nearly three quarters of organizations are operating workforce plans that they themselves consider fragile. The gap between knowing what good looks like and having built it is where most HR functions sit.
Organizations with mature workforce forecasting programmes, defined as those running quarterly refresh cycles with driver-based demand models, skills-level supply models, and verified forecast accuracy tracking, consistently report specific outcome improvements over their pre-forecasting baseline: 20 to 35% improvement in headcount planning accuracy, 15 to 25% reduction in reactive hiring premium costs, 30 to 40% improvement in internal fill rates for forecast-identified gaps, and revenue growth 2.4 times faster than reactive-hiring comparators.
For Finance, the benchmark that matters most is forecast-to-budget variance. Organizations with a formal workforce plan that Finance trusts consistently report headcount cost forecast-to-budget variance below 7%, compared to 15 to 25% variance in organizations without a structured forecasting process. That variance reduction represents a material improvement in budget reliability that CFOs recognize as a direct contribution from HR to financial planning quality.
Suggested Article: Workforce Demand Forecasting
Skills-Based Workforce Forecasting: Beyond Headcount to Capability
Headcount forecasting tells you how many people you will need. Skills-based forecasting tells you what those people need to be able to do. The distinction produces fundamentally different planning outputs and fundamentally different business value.
A headcount forecast that says “we need 40 additional engineers by Q3” is the beginning of a useful planning conversation. A skills-based forecast that says “we need 40 engineers with cloud architecture at intermediate level or above, Python at advanced level, and at least foundational machine learning by Q3, and our current supply model shows 23 of those people exist internally within one proficiency level of the requirement” is a complete planning conversation that includes the internal development pathway, the external hiring gap, and the cost comparison between the two routes.
How Skills-Based Forecasting Changes the Build-Buy-Redeploy Decision
Traditional headcount forecasting defaults every gap to external hiring because the forecast produces a number, not a capability description. When the gap is expressed in skill terms, the first evaluation is always internal: which employees have adjacent skills that could be developed toward the requirement within the planning horizon, and at what cost compared to external market rates for those capabilities?
According to LinkedIn’s 2025 Workforce Mobility Report, attrition variance across role families inside the same company averages 18 percentage points. A company-wide attrition number hides where the skill supply is actually declining fastest. Skills-based supply modeling segments attrition by capability cluster, not just by role title, which reveals that you may be losing data science expertise at 28% annually while losing generalist operations capability at 9%. The external hiring response and the cost implications are completely different for those two patterns, and a title-based headcount model cannot distinguish them.
External Skills Signal Integration
Skills-based forecasting requires one data source that headcount forecasting does not: external market signals showing which skills are emerging, in demand, stable, or declining in the labor market at any given time. A skills supply model that only looks inward cannot answer the question of whether a capability you are planning to develop internally is becoming more or less available externally, which directly affects the build-versus-buy calculation.
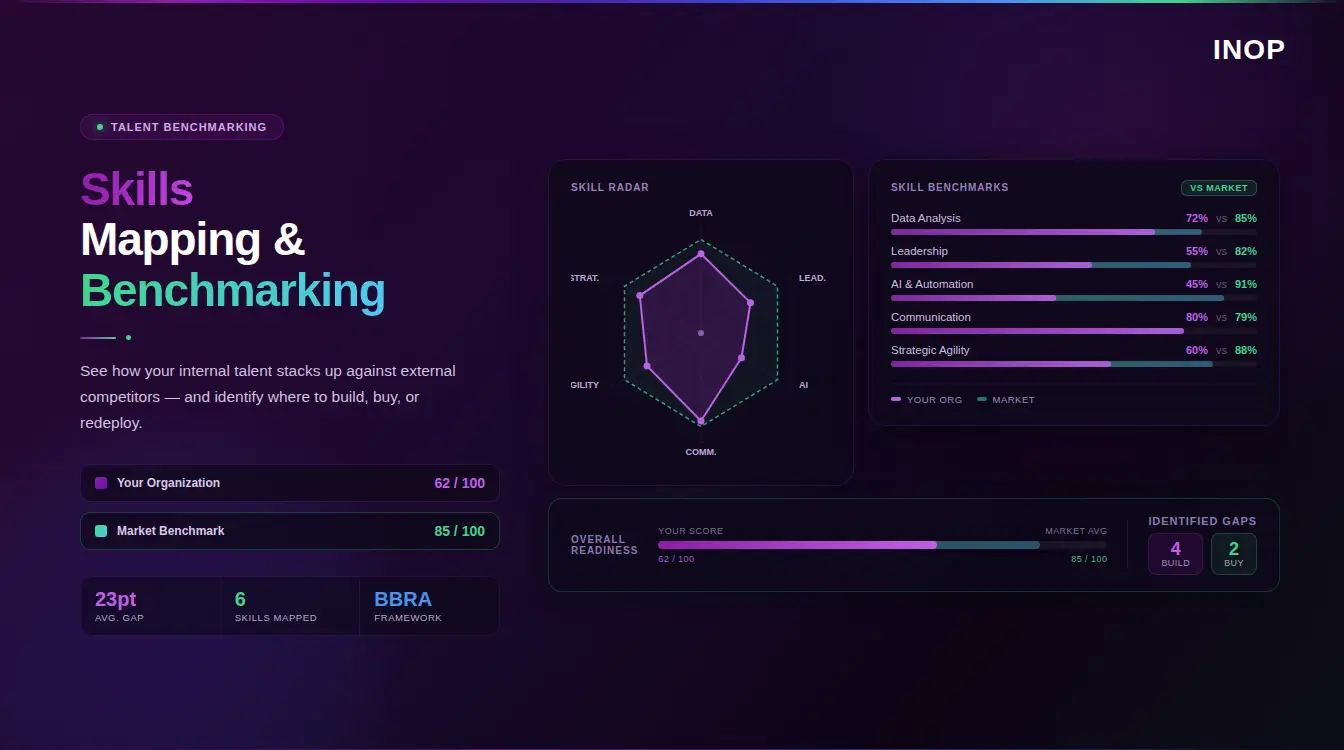
INOP’s skills intelligence platform maps internal skill taxonomies against real-time external demand signals across four states: Emerging, In Demand, Stable, and Declining. This external validation layer is what turns an internal gap analysis into a defensible build-versus-buy recommendation rather than an assumption.
See how a demand and supply model comes together in practice. Book a demo to walk through INOP’s forecasting workflow, from role-family attrition data to a financially modeled recommendation.
Workforce Supply Forecasting Explained
Supply forecasting answers the other half of the question: how many people will you actually have, in each role, at each future point, if you make no new hiring decisions at all. It starts with current headcount and applies three adjustments. Attrition, modeled by role family and tenure band rather than as a single company-wide rate, since attrition variance across role families inside the same company is often significant enough to hide where the real risk sits if it is averaged away. Internal mobility, how many people will move out of a role into another one internally, which most organizations underestimate because they do not track it systematically. And pipeline conversion, for any hiring already underway, the realistic offer-to-start conversion rate rather than an optimistic one.
Supply Inputs to Track
A usable supply model needs, at minimum, rolling twelve-month attrition by role family and location, documented internal mobility flows, time-to-fill by role family for anything still in progress, and a leave and return-from-leave assumption for roles where that materially affects capacity. Most organizations have some of this data scattered across the HRIS, the ATS, and manual spreadsheets. The forecasting exercise only works if that data gets consolidated into one supply model before it is compared against demand.
Building an Attrition Model That Actually Works
Attrition is the variable that breaks more supply models than any other. Most organizations measure it as a single blended number: 14% annual attrition across the company. That number is accurate in the aggregate and useless for forecasting, because attrition variance across role families inside the same organization typically spans 15 to 25 percentage points. Your overall 14% may be hiding 28% attrition in data engineering, 8% in operations, and 22% in senior sales. A supply model that applies 14% uniformly will significantly overestimate future supply in your highest-risk functions and underestimate it in your most stable ones.
Segment attrition across three dimensions before using it in any supply model. First, by role family: engineering, sales, operations, finance, and other major functions each have distinct attrition patterns driven by different labor market dynamics. Second, by tenure band: voluntary attrition in the first 18 months of employment typically reflects onboarding and expectations failures. Attrition between 18 months and four years typically reflects career development or compensation gaps. Attrition beyond four years typically reflects retirement risk or leadership dissatisfaction. Each tenure band requires a different retention intervention and a different supply model assumption. Third, by location: attrition in a tight local labor market differs structurally from attrition in a remote-first population, and combining them into a single number hides the geographic planning implications.
Predictive attrition models add a further layer: rather than projecting historical attrition rates forward, they identify which specific employees are at elevated flight risk based on combinations of compensation percentile, tenure, manager change recency, promotion history, and engagement signal data. This individual-level prediction converts attrition from a statistical assumption in the supply model to a named list of retention priorities, which changes what HR can do with the forecast dramatically.
Predictive Workforce Analytics and How It Differs from Traditional Forecasting
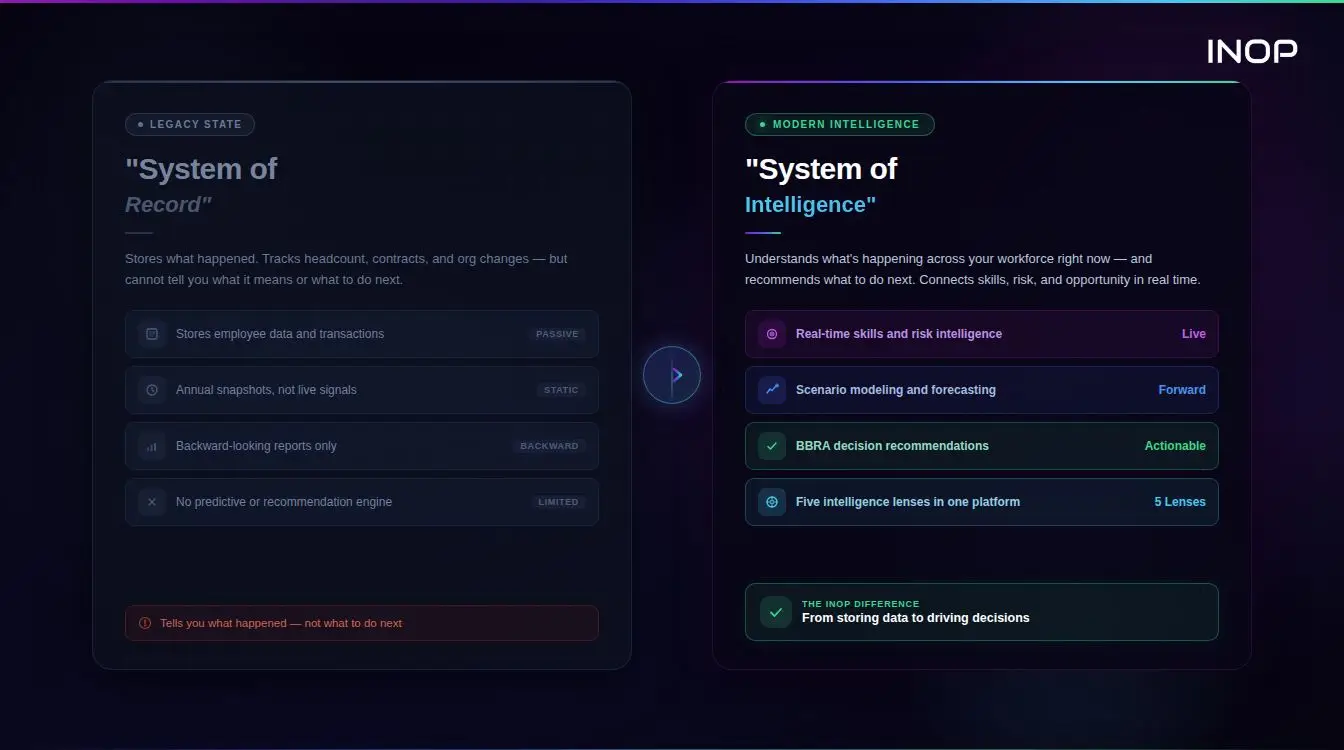
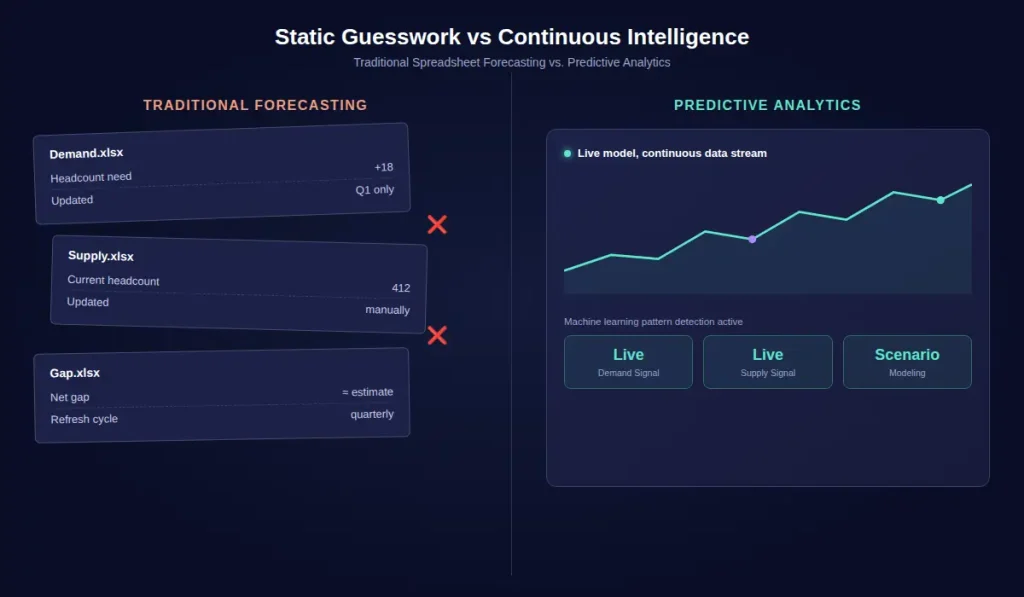
Traditional workforce forecasting relies on manually built spreadsheet models: a demand tab, a supply tab, a gap calculation, updated quarterly by an analyst. Predictive workforce analytics applies statistical and machine learning models to the same underlying data to generate forecasts continuously, surface patterns a spreadsheet would miss, and update automatically as new data arrives rather than waiting for the next planning cycle.
Where Machine Learning Adds Value Over Spreadsheets
The practical difference shows up in three places. First, pattern detection: machine learning models can identify that attrition risk correlates with a combination of tenure, manager change, and compensation percentile in ways a single-variable spreadsheet formula cannot capture. Second, continuous updating: a predictive model can refresh its forecast weekly as new attrition and hiring data comes in, rather than sitting static between quarterly planning cycles. Third, scenario speed: once a model is built, running a downside or upside scenario is a parameter change, not a rebuild. That speed matters most exactly when it is needed most, during a sudden demand shift, when a static spreadsheet model is the slowest possible way to get an answer.
Workforce Forecasting Models and Methods
Bottom-Up and Top-Down Forecasting
Bottom-up forecasting builds the number from the ground up: each manager or department head forecasts their own team’s headcount needs, and those roll up into a company total. It captures operational nuance well but is prone to inconsistent assumptions across departments and, left unchecked, a tendency for every manager to request more headcount than the business actually needs. Top-down forecasting starts from a company-level target, often derived from a revenue-to-headcount ratio, and allocates it down to business units. It enforces financial discipline but can miss operational reality at the team level. The strongest workforce forecasting models use both together: a top-down target for financial guardrails, reconciled against a bottom-up build for operational accuracy, with the two forced to converge before the forecast is finalized.
Regression and Time-Series Models
Regression models predict headcount as a function of one or more business drivers, revenue, transaction volume, customer count, and are useful when a clear historical relationship exists between the driver and staffing levels. Time-series models, including moving averages and ARIMA-style approaches, forecast future headcount based on historical headcount patterns and seasonality alone, which works well for roles with stable, cyclical demand, such as seasonal retail or hospitality staffing, but poorly for roles undergoing structural change, where the past is a weak predictor of the future.
Scenario and Monte Carlo Simulation
Scenario planning builds three to five discrete future states, typically a base case, an upside case, and a downside case, and forecasts headcount needs under each. Monte Carlo simulation goes further, running thousands of randomized iterations across a range of input assumptions to produce a probability distribution of outcomes rather than a single point estimate. This matters most for workforce decisions with long lead times, where being wrong by the time a role is finally filled is far more expensive than the modeling effort required to avoid it.
How Forecasting Approaches Differ by Industry
The forecasting model that works for a professional services firm with stable headcount and predictable project pipelines will not work for a healthcare network managing shift coverage, licensing requirements, and seasonal demand simultaneously. Matching the model to the industry context is as important as the technical quality of the model itself.
Healthcare forecasting operates across two distinct horizons simultaneously. Short-horizon labor forecasting, predicting shift-level staffing requirements by department and patient census, runs on a weekly or monthly cycle and feeds directly into scheduling systems. Strategic workforce forecasting, predicting the supply of licensed clinical roles like RNs, APRNs, and specialist physicians across a two to five year horizon, feeds into recruitment, training pipeline, and compensation strategy decisions. The regulatory dimension adds a constraint that most other industries do not face: credentialing timelines create minimum lead times for capability development that cannot be compressed regardless of demand urgency.
Retail and hospitality require short-horizon labor forecasting as the primary planning instrument, with seasonal demand patterns, promotional event overlays, and real-time traffic or transaction data as the primary demand drivers. Strategic workforce planning at the store manager and above level follows a more conventional model, but the hourly workforce plan operates on a fundamentally different cadence and requires different tools.
Technology and professional services firms face the challenge that their most critical workforce capabilities are also the most rapidly evolving. A skills-based forecasting approach is particularly valuable here because title-based headcount forecasting fails to capture the material differences between engineers at different skill levels, or between data scientists with and without production ML experience.
Manufacturing and logistics face a planning challenge structured around both capacity and capability: the number of people needed to operate equipment at rated capacity, and the specific certifications and training required to operate safely. Skills-based forecasting for frontline roles in these industries often involves modular skill blocks tied directly to equipment qualifications, where each block has a known training duration that constrains the development timeline.
Every forecasted gap deserves a build, buy, redeploy, or automate answer, not an automatic requisition. Book a demo to see how INOP’s strategic workforce planning platform sequences that decision against your own forecast data.
Workforce Forecasting Tools Compared
| Tool | Best For | Forecasting Approach | Notable Limitation |
|---|---|---|---|
| Workday Adaptive Planning | Finance-led headcount planning | Driver-based, revenue-linked models | Limited skills-level granularity |
| SAP SuccessFactors Workforce Planning | Enterprises already on SAP | Scenario modeling within HCM | Heavier implementation lift |
| Anaplan | Cross-functional financial and workforce modeling | Configurable driver-based modeling | Requires significant setup and modeling expertise |
| Visier | People analytics and descriptive forecasting | Statistical trend and attrition modeling | Stronger on analytics than on prescriptive action |
| Deputy | Shift-level labor forecasting for hourly teams | Short-horizon demand forecasting | Not built for strategic, multi-year workforce planning |
| Workforce.com | Multi-location labor demand forecasting | AI-driven short-horizon scheduling forecasts | Same short-horizon focus as Deputy, limited strategic layer |
Enterprise Platforms for Workforce Forecasting
Workday Adaptive Planning and Anaplan both serve organizations that want workforce forecasting tied tightly to the financial planning process, letting finance and HR work from the same driver-based model rather than reconciling two separate spreadsheets after the fact. SAP SuccessFactors serves the same purpose for organizations already standardized on SAP’s HCM suite. Visier is strongest where the goal is understanding what has already happened and projecting recent trends forward, descriptive and trend-based forecasting, rather than building forward-looking scenario models from business drivers.
Point Solutions for Labor and Staff Forecasting
For hourly and shift-based staff forecasting rather than salaried strategic headcount planning, Deputy and Workforce.com are purpose-built for short-horizon demand forecasting: predicting how many people are needed on the floor in the next shift, day, or week based on historical traffic, sales, or call volume patterns. Both integrate directly into scheduling. Neither is designed to answer a multi-year strategic workforce forecasting question, and organizations that need both a shift-level labor forecast and a strategic multi-year workforce forecast should expect to run two connected but distinct tools rather than looking for one platform to do both well.
Workforce Planning and Forecasting: Connecting the Two Processes
Workforce planning and forecasting only produce value together, and the handoff between them is where most programs actually fail. A forecast that sits in an analyst’s spreadsheet, disconnected from the planning conversations where hiring, redeployment, and budget decisions get made, is wasted analytical effort. The forecast should feed directly into the planning cadence: quarterly business reviews, annual budget cycles, and headcount approval workflows, so that the numbers driving a hiring decision are the same numbers finance is using to build the budget, rather than two versions of the truth arrived at independently.
Organizations that formalize this connection see it show up in performance. Companies with a documented workforce plan built on a real forecast, rather than reactive hiring, have been found to grow revenue roughly 2.4 times faster than companies that hire reactively, according to Klearskill’s 2026 workforce planning guide, which cites McKinsey’s 2025 Workforce Planning Index.
Building a Workforce Forecasting Roadmap
Define the Forecasting Horizon and Cadence
Decide how far out you are forecasting, typically twelve to thirty-six months for strategic workforce forecasting, and how often the forecast refreshes. Quarterly refresh cycles, aligned to the financial planning calendar, work for most organizations. Faster-moving businesses may need a rolling monthly update for critical role families.
Build the Demand and Supply Models
Build the demand model from business drivers, not headcount extrapolation, and the supply model from attrition, mobility, and pipeline data by role family, not a single blended assumption. Keep the two models separate before comparing them; collapsing them too early hides where the actual gap is coming from.
Validate Against Finance
Before the forecast goes anywhere near a planning conversation, reconcile it against finance’s own headcount and cost assumptions. A workforce forecast that finance does not trust will not survive its first budget cycle, regardless of how sound the underlying model is.
Operationalize the Forecast
Connect the forecast output to the systems that act on it: hiring plan approvals, internal mobility postings, and reskilling program targeting. A forecast that identifies a gap without triggering a specific action is analysis without impact.
Review and Recalibrate
Track forecast accuracy against actual outcomes every cycle, and recalibrate the model when it drifts. A forecasting process that never checks its own accuracy will not improve, and will slowly lose the organization’s trust even if the underlying logic was sound to begin with.
Measuring Workforce Forecast Accuracy: The Metrics That Matter
A forecasting process that never tracks its own accuracy will not improve, and will quietly lose organizational trust even when the underlying methodology is sound. The following metrics provide the measurement framework that turns a forecasting exercise into a continuously improving system.
Mean Absolute Percentage Error (MAPE) is the standard accuracy metric for workforce forecasts. It measures the average percentage difference between forecasted headcount and actual headcount across role families and time periods. A MAPE below 10% indicates a high-performing forecast. Between 10% and 20% is acceptable for strategic forecasting over a 12 to 18 month horizon. Above 20% suggests a structural problem with either the demand model inputs or the supply assumptions that needs investigation before the next forecast cycle.
Directional accuracy measures something MAPE does not capture: whether the forecast correctly predicted the direction of change, even if the magnitude was off. An organization that consistently forecasts surplus when the actual outcome is shortage has a model bias problem that MAPE would average away if the over- and under-predictions are symmetric.
Forecast-to-actual reconciliation by role family is the most actionable accuracy metric because it identifies specifically where the model is failing rather than producing a single blended accuracy number. If your engineering forecast is consistently 15% below actual and your operations forecast is consistently 8% above actual, those patterns suggest different model problems that require different interventions.
Track accuracy on a rolling basis and review it at the start of every quarterly planning cycle. Build a simple accuracy log that records the forecast value, the actual value, the MAPE, and a brief notation on what drove the variance. After four to six quarters, patterns in the variance log will reveal whether the forecast is improving, stable, or degrading, and which parts of the model are contributing most to error.
Connecting Workforce Forecasting to Recruitment and Reskilling Plans
A demand and supply gap identified by the forecast can be closed in more than one way, and treating external hiring as the default response is where most workforce forecasting programs quietly become expensive. For any given gap, the same forecast data should be evaluated against internal mobility and reskilling first: does the organization already have people with adjacent skills who could move into the gap with a defined development plan, before defaulting to an external search. Forecast output that includes a skills dimension, not just a headcount number, makes that evaluation possible. That skills layer is what turns a raw headcount gap into a genuine build, buy, redeploy, or automate decision rather than an automatic requisition, and it is the same skills data that feeds INOP’s Skills Intelligence layer to validate internal capability against external market signals before a gap gets escalated to external search.
Want to see demand and supply gaps evaluated against internal capability first? Book a demo to see how INOP sequences the build, buy, redeploy, and automate decision.
Workforce Forecasting for PE Portfolio Companies
For private equity operating partners, workforce forecasting serves a purpose distinct from steady-state HR planning: it is the mechanism for stress-testing a hundred-day plan and a value creation thesis against realistic headcount and cost trajectories, rather than assumptions baked into a deal model before diligence ever touched workforce data. A forecast built at acquisition, covering demand under the planned growth trajectory and supply under realistic attrition assumptions for that specific workforce, surfaces cost and capability risk early enough to act on it, rather than discovering it in the first missed quarter post-close.
The value compounds across a portfolio. A consistent forecasting methodology applied across multiple portfolio companies lets operating partners compare workforce cost trajectories, attrition risk, and capability gaps across entities on the same basis, informing both integration sequencing and pre-exit workforce cost defensibility, rather than relying on each portfolio company’s own ad hoc HR reporting.
Common Pitfalls in Workforce Forecasting
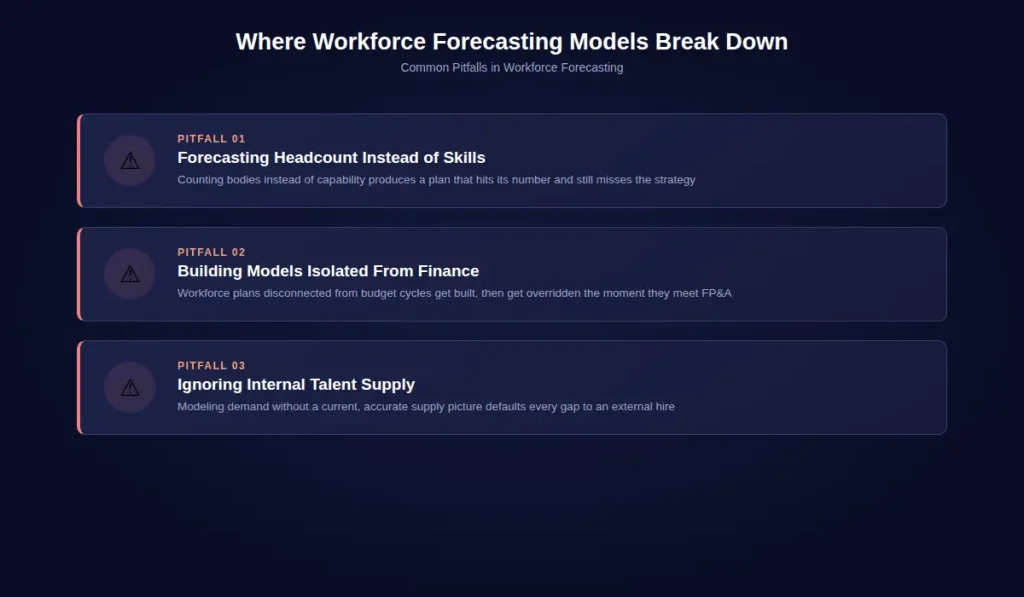
Forecasting headcount instead of skills. A forecast that produces a single headcount number by role title misses the more useful question, which specific skills will be in short supply, and by when. Two people with the same job title can have very different capability profiles.
Treating the forecast as a one-time exercise. A forecast built once a year and never revisited drifts from reality within a quarter in any business experiencing real change. Recalibration on a defined cadence is not optional maintenance, it is what keeps the forecast usable.
Building the model in isolation from finance. A workforce forecast that HR builds independently of finance’s own revenue and cost assumptions will produce numbers finance does not trust, and a forecast finance does not trust will not survive a budget cycle.
Ignoring internal supply. Forecasts that model demand carefully but treat supply as “whatever we hire” systematically overstate the external hiring need and understate the internal mobility and reskilling opportunity sitting inside the existing workforce.
No accuracy tracking. Without measuring forecast accuracy against actual outcomes, there is no way to know whether the model is improving, degrading, or simply wrong in a consistent, correctable direction.
Suggested Article: Workforce Forecasting Mistakes
Workforce Forecasting KPIs: Measuring Whether Your Programme Is Working
A forecasting programme without outcome metrics is an analytical exercise. The following KPIs connect forecasting quality directly to the business outcomes that justify the investment.
Forecast MAPE by role family measures model accuracy at the level of granularity where it is most actionable. Track this quarterly and use variance analysis to identify which role families and which model assumptions are contributing most to error.
Time-to-fill for planned versus unplanned requisitions tests whether forecasting is actually producing proactive hiring pipelines. Organizations with mature forecasting programmes consistently show 20 to 35% lower time-to-fill for roles that appeared in the forecast versus roles that emerged as unplanned urgent needs. If your planned and unplanned time-to-fill are similar, the forecast is not far enough ahead of the actual hiring cycle to create a pipeline advantage.
Internal fill rate for forecast-identified gaps measures whether the forecast is enabling internal mobility or defaulting every gap to external search. If the forecast identifies a capability gap in advance but the resolution is always external hiring, the skills-based evaluation step is either missing from the process or being bypassed.
Forecast-to-budget variance is the metric that matters most to Finance. Track the percentage difference between headcount costs forecasted at the start of a planning cycle and actual headcount costs at the end. Organizations reporting forecast-to-budget variance below 5% have earned the level of Finance trust that makes workforce planning a genuine strategic input rather than a periodic reporting exercise.
Headcount planning accuracy at 6 and 12 months measures the forecast’s predictive validity at the horizons where it matters most for strategic decisions. A forecast that is highly accurate at three months but significantly wrong at 12 months signals a model that relies too heavily on current conditions and underweights structural trends.
How INOP Turns Workforce Forecasts Into Action
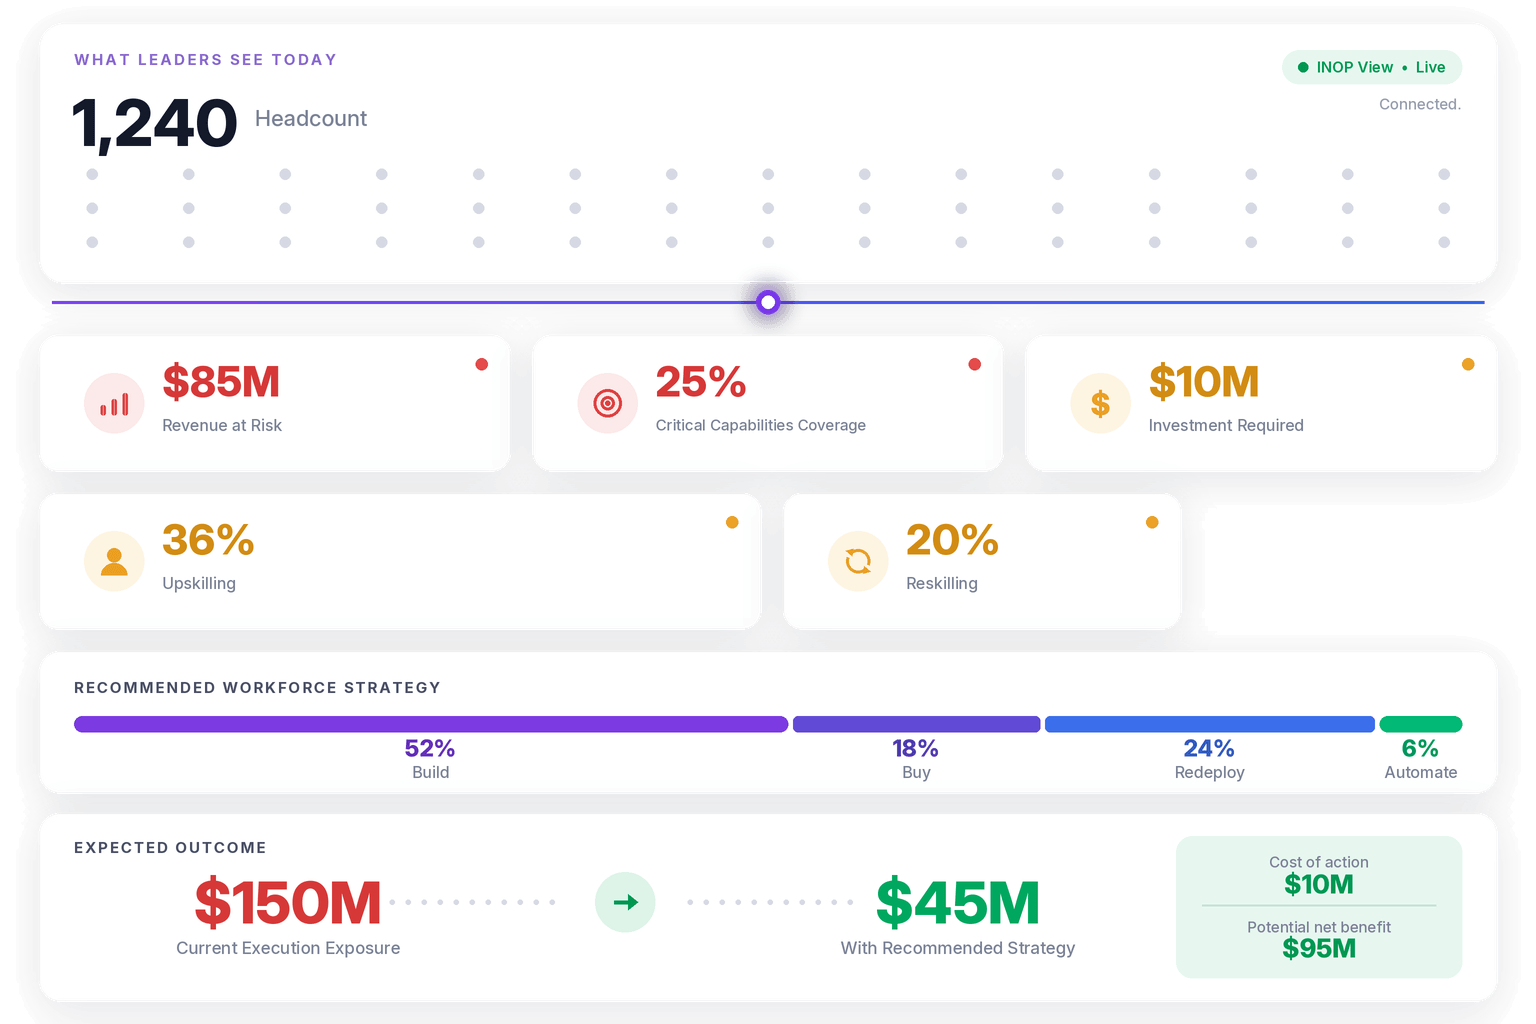
A forecast is only as valuable as the decision it drives. INOP builds workforce forecasting into a continuous decision layer, synthesized across five integrated lenses, Strategy, Finance, People, Market, and AI and Automation, so a demand and supply gap does not just get reported, it gets resolved.
When INOP’s forecasting identifies a gap, it is evaluated through Build, Buy, Redeploy, Automate (BBRA), INOP’s proprietary decision architecture, which models the financial trade-offs of each response pathway across thirty-day, one-hundred-eighty-day, one-year, and three-year horizons, rather than defaulting every gap straight to a hiring requisition. That evaluation runs inside INOP’s Strategic Workforce Planning platform, where the Workforce Risk Engine and Decision Intelligence Layer connect the forecast to a specific, financially modeled recommendation rather than a static report.
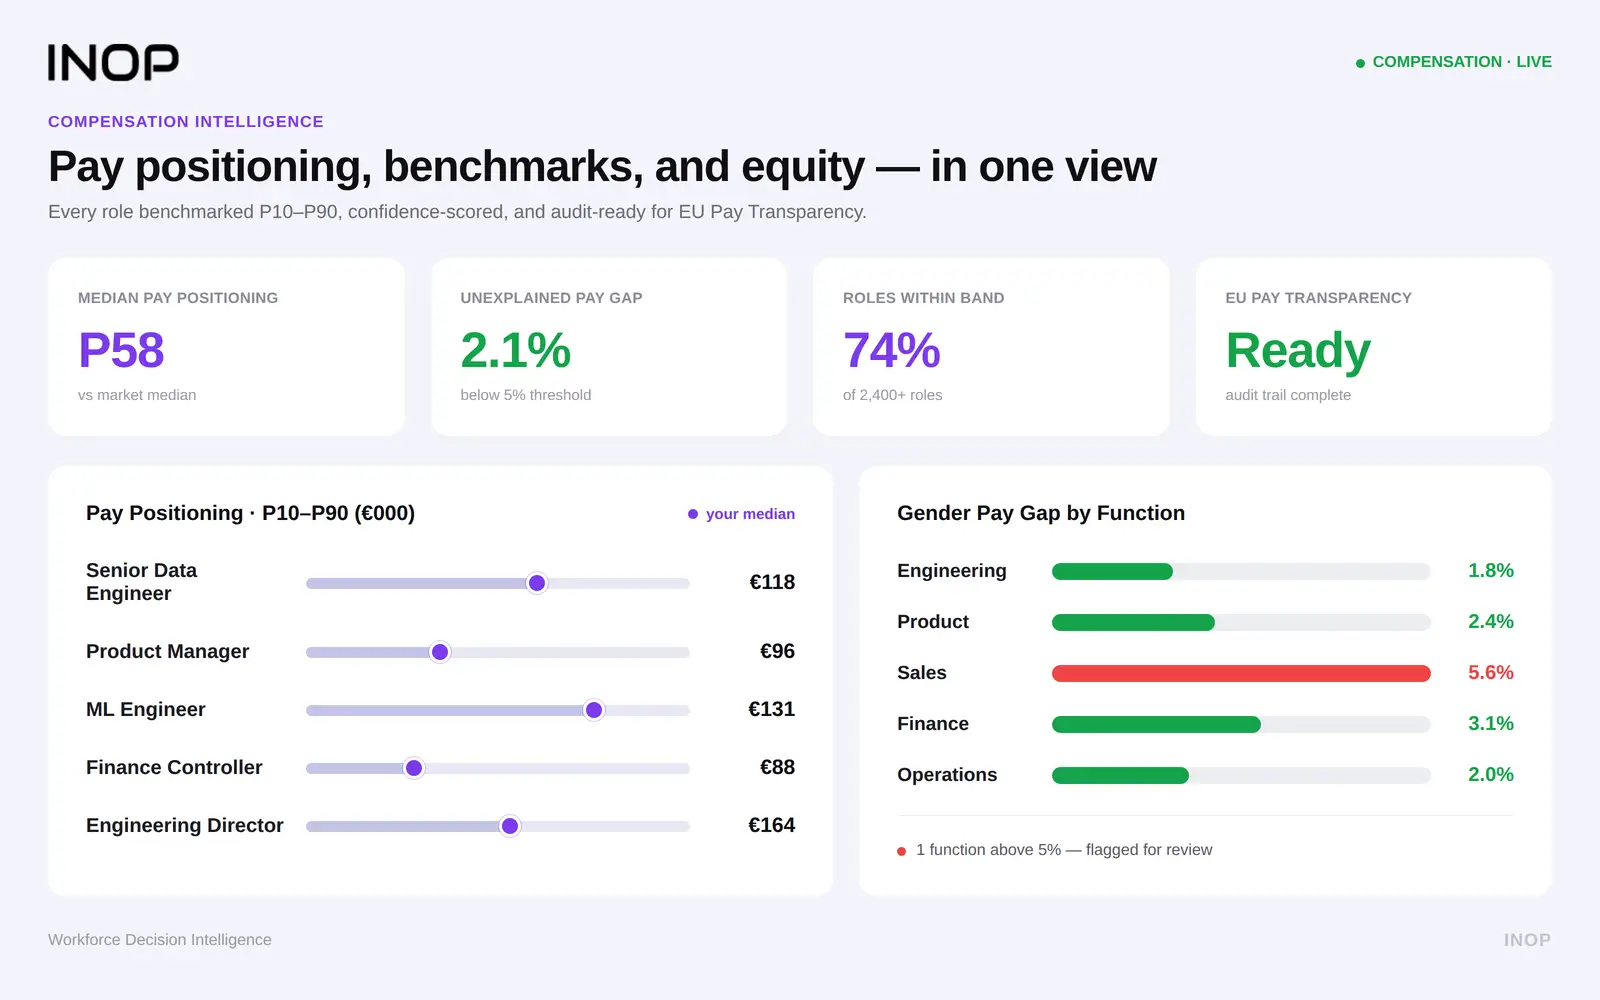
Because every workforce decision has a cost dimension, forecasted gaps are also evaluated against INOP’s Compensation Analytics platform, so a redeployment or reskilling recommendation is weighed against its real cost relative to external hiring, using current market compensation data rather than a stale internal pay band.
Organizations that predict workforce and workplace trends ahead of time are meaningfully more likely to execute change successfully than those that plan reactively, sixty-one percent versus forty-five percent according to SHRM’s research on the new era of workforce planning, which is the practical case for treating forecasting as infrastructure rather than an annual exercise.
Conclusion
Workforce forecasting done well replaces guesswork with a demand and supply model finance actually trusts, a set of quantitative methods matched to the decision at hand, and a direct connection to the internal mobility, reskilling, and hiring decisions the forecast is meant to inform. The organizations getting real value from it are not the ones with the most sophisticated model, they are the ones that closed the loop between forecast, plan, and action, and kept recalibrating as the business changed underneath them.