Most CHROs already know their organisation has skill gaps. What they often do not know is exactly where those gaps are, how severe they are compared to industry peers, and which ones are quietly costing the business competitive ground. That is the problem skills mapping is designed to solve, and it is why the practice has moved from a nice-to-have exercise into one of the most strategically important disciplines in modern HR leadership.
This article walks you through what skills mapping really involves, how to benchmark your internal talent against competitors effectively, and how to turn those findings into workforce decisions that actually move the business forward. Whether you are starting from scratch or looking to mature an existing approach, you will leave with a clear framework and actionable next steps.
What Is Skills Mapping and Why Does It Matter Now
Skills mapping is the process of systematically identifying, cataloguing, and analysing the capabilities that exist within your workforce. It goes well beyond listing job titles or reviewing CVs. A true skills map gives you a granular, validated picture of what your people can actually do, at what level of proficiency, and how those capabilities align with both current operational needs and future strategic priorities.
The urgency has never been higher. According to the World Economic Forum’s Future of Jobs Report 2025, skill gaps are now cited by 63% of employers as the single biggest barrier to business transformation. The same report projects that 39% of existing core skill sets will be transformed or become outdated by 2030, meaning the content of roles will shift dramatically even where the roles themselves remain. Separately, the report estimates that 59% of the global workforce will require reskilling or upskilling by that same date, a figure that captures the sheer scale of people who will need active intervention, not just the skills themselves that will change. Together, these two statistics describe the same crisis from two different angles: capability obsolescence at the skill level, and readiness risk at the workforce level.
For CHROs, this creates a very specific challenge. You cannot manage what you cannot see. And if you cannot see your own capability landscape in enough detail to benchmark it against the market, you are effectively flying without instruments.
The Cost of Not Mapping: What Organisations Pay for Skills Blindness
The strategic case for skills mapping is compelling. The financial case is equally specific, and for sceptical finance leaders, it is the more persuasive argument.
87% of companies face skills gaps, but most discover them reactively — when a project fails, a critical employee departs, or a strategic initiative cannot be staffed. Reactive discovery is systematically more expensive than proactive identification. An organisation that identifies a gap in cloud architecture capability six months before a critical technology migration can address it through development or targeted recruitment with adequate lead time. The same organisation that discovers the gap three weeks before the migration launches faces emergency contracting costs, delivery delays, and potentially a failed implementation.
Research cited by VerifyEd indicates that organisations with systematic skills mapping in place report 60% higher organisational effectiveness and that using multiple skill evaluation tools reduces voluntary turnover by 46%. Both figures connect to financial outcomes that finance leaders can model: a 46% reduction in voluntary turnover for a 200-person organisation with 15% annual attrition and an average replacement cost of 100% of salary translates to approximately $3 million in avoided replacement costs annually, before accounting for productivity during vacancies and ramp-up periods.
The cost of skills blindness also shows up in misallocated L&D spend. Without a skills gap analysis connected to business priorities, training investment defaults to historical patterns, manager preferences, and available catalogue rather than critical capability requirements. The proportion of L&D spend directed at skills with no measurable business impact is typically 30% to 40% in organisations without skills mapping, a figure that represents recoverable investment once the mapping discipline is in place.
The Difference Between Skills Inventory and Skills Mapping
Before going further, it is worth separating two terms that are often used interchangeably but are not the same thing.
A skills inventory is a record of the skills that exist in your organisation. Think of it as a database: employee A has Python, project management, and stakeholder communication; employee B has financial modelling, data visualisation, and Agile methodology. Useful, but static.
Skills mapping goes several steps further. It overlays that inventory against:
- The skills your current roles require to perform effectively
- The skills your future strategy will depend on
- The skills your competitors are actively hiring for or developing
- The skills that are at risk of obsolescence due to automation or market shifts
This multi-dimensional analysis is what turns a list of capabilities into a strategic asset. It is the difference between knowing what you have and understanding what it means.
Skills Mapping vs. Skills Matrix: Understanding the Distinction
Two terms appear frequently in this space and are often conflated in a way that creates practical confusion when organisations try to build either one.
A skills matrix is a visual tool, typically a grid, that plots employees or roles against skills, showing at a glance where capability exists and where it is absent. It is role-agnostic in that it shows capabilities wherever they live in the organisation, not just where they are expected based on job titles. The matrix format, often supported by colour coding for proficiency levels, turns complex capability data into something that a team leader or department head can read and act on without data science training. It is the most common output format for skills mapping data when the audience is operational rather than strategic.
Skills mapping is the broader discipline that produces the data the matrix displays. It includes defining the taxonomy, collecting multi-source validated data, benchmarking against external market demands, and connecting the findings to workforce decisions. The matrix is one output of skills mapping. Skills mapping is not the same thing as building a matrix.
The practical implication: an organisation that builds a skills matrix without the underlying skills mapping methodology has a good-looking grid built on unreliable data. An organisation that does thorough skills mapping without producing a matrix has intelligence that nobody can navigate quickly. Both are valuable, and the relationship between them is that the mapping produces the foundation the matrix presents.
For organisations starting out, the skills matrix format is a useful way to begin the skills mapping conversation with business leaders: it is visual, intuitive, and immediately reveals concentration risks and gaps in a format that requires no explanation. The discipline and rigour of the broader mapping methodology is what prevents that matrix from becoming misleading as data becomes stale or collection methods become inconsistent.
How to Build a Skills Map: A Practical Framework
There is no single right way to build a skills map, but the most effective approaches tend to follow a consistent sequence of steps. Here is a framework that works for organisations of most sizes and sectors.
Define Your Skills Taxonomy
Before you can map anything, you need a shared language. A skills taxonomy is a structured, hierarchical classification of the skills relevant to your organisation. It distinguishes between broad categories (for example, data literacy) and specific competencies within them (SQL proficiency, statistical modelling, data visualisation).
The taxonomy has to be practical, not theoretical. It needs to reflect the real skills your business runs on, not a generic HR framework copied from the internet. Many organisations now build taxonomies collaboratively, pulling input from business leaders, subject matter experts, and frontline employees, then validating them against external labour market data.
According to Mercer’s 2025/2026 Skills Snapshot Survey, 38% of organisations now maintain a single, enterprise-wide skills library, up from 30% in 2023, and 55% are actively mapping skills directly to jobs, up from 47% two years prior. Those figures are growing fast, and they matter because fragmented taxonomies across business units make benchmarking almost impossible.
Collect Skills Data Across Multiple Sources
Self-assessments alone are not sufficient. Research consistently shows that self-reported proficiency levels are unreliable without triangulation. A robust skills data collection process combines:
- Employee self-assessments (with structured proficiency scales, not free text)
- Manager validations (calibrating against observable performance)
- Project and work history (inferring skills from what people have actually done)
- Learning and certification records (from LMS and external credential platforms)
- Performance review data (qualitative signals about capability in practice)
The goal is a skills profile that is both broad enough to be comprehensive and specific enough to be actionable.
Map Skills to Roles and Strategic Priorities
Once you have your data, the next step is to overlay it against what the business actually needs. This means mapping skills to:
- Current role requirements: Does each role have a defined skills profile? Are your people meeting it?
- Future strategic requirements: What capabilities will your three-year plan demand? Do you have them? Where are the critical gaps?
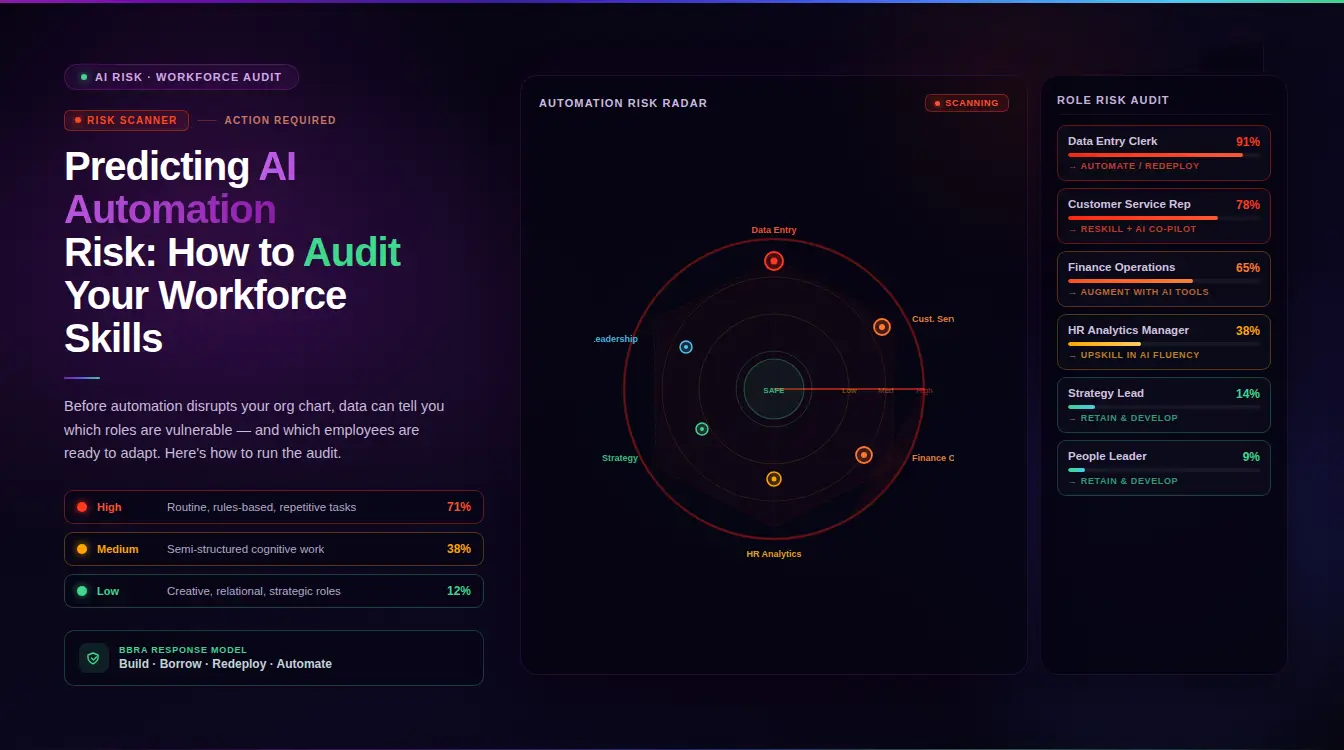
- Automation risk: Which of your current skills are being replicated by AI or automation tools? Where should you be redeploying human effort?
This is where skills intelligence becomes essential. Rather than running this as a periodic HR exercise, modern platforms continuously update the skills map as your workforce changes, your strategy evolves, and the external market shifts.
Skills Mapping Template: What to Include and How to Structure It
A skills mapping framework described in prose is easier to act on when accompanied by a concrete template structure. The following covers what an effective skills map needs to contain across three levels: the role profile, the individual assessment record, and the organisational summary view.
The Role Profile Layer
Every skills map begins with a role profile that defines what capabilities are required for each position, at what proficiency level, and why each matters to business outcomes. This is the target state against which actual employee profiles are measured. A complete role profile includes the skill name, the skill category following your taxonomy structure, the minimum proficiency level required for standard performance, the advanced proficiency level that enables contribution beyond the role’s base requirements, and the business outcome that the skill enables. That last element is what connects the skills map to strategic priorities rather than leaving it as an HR documentation exercise.
The Individual Assessment Record
For each employee assessed against the role profile, the record should capture their self-assessed proficiency on each skill, manager-validated proficiency where the two diverge significantly, any objective verification from assessments, certifications, or work product review, the date of the last assessment, and the gap score calculated as the difference between required and current proficiency. Documenting the assessment date is not administrative detail. It is the governance mechanism that tells you when the data is too old to be reliable.
The Organisational Summary View
Aggregating individual records produces the view that HR leaders and business heads need for planning purposes. This layer should show average proficiency by skill across each team and function, the percentage of employees meeting the required proficiency threshold for each capability, the skills where fewer than 60% of the relevant population meets the requirement, flagged as critical coverage risks, and trend data comparing current assessment against the previous one to show whether gaps are closing or widening. Without trend data, the skills map cannot tell you whether your development investment is working. With it, you have a continuous feedback loop between investment and outcome.
Practical Format Guidance
For teams under 50 people, a well-structured spreadsheet with conditional formatting to highlight gaps and proficiency levels visually is entirely adequate. Use rows for skills, columns for employees, and a reference row showing the required proficiency level for each skill. Colour-code cells by whether the employee meets, approaches, or falls below the requirement. This produces the skills matrix view described earlier in this article from the mapping data your assessment process generates.
For organisations above 100 employees, the manual aggregation and update burden typically justifies investment in a dedicated platform. The spreadsheet approach that works for a 40-person engineering team becomes unmanageable for a 400-person business unit, not because the methodology changes but because the data volume and update frequency exceed what human processes can sustain reliably.
Benchmarking Internal Talent Against External Competitors
Internal skills mapping is valuable. External benchmarking is what makes it strategic.
Knowing that your data engineering team has strong SQL skills tells you something. Knowing that your competitors’ data engineering teams are operating at a significantly higher level of cloud architecture and ML pipeline expertise tells you something actionable. The latter is the kind of intelligence that shapes hiring decisions, L&D investment, and even product roadmaps.
What External Benchmarking Looks At
When CHROs talk about benchmarking talent externally, they typically look at four dimensions:
Skill prevalence: What percentage of your workforce holds a given skill compared to the industry average? If 40% of your competitors’ marketing teams are proficient in marketing analytics tools and only 12% of yours are, that is a structural gap, not a training calendar issue.
Skill depth: It is not just about who has a skill, but how advanced their proficiency is. A team full of beginner-level Python users operates very differently from one with intermediate to advanced practitioners.
Skill velocity: Which skills are your competitors acquiring or developing at speed? Tracking hiring patterns, job postings, and learning investment signals can reveal where the market is moving before those shifts become visible in traditional labour data.
Skill concentration risk: Are critical capabilities held by just one or two individuals? Competitors with broader skill distribution across teams are more resilient to attrition and better positioned for scaling.
Where External Benchmark Data Comes From
External skills benchmarking draws from a combination of sources:
- Labour market data platforms that aggregate millions of job postings, identifying what skills employers are demanding and how that demand is changing over time
- Professional network data (such as LinkedIn’s Workforce Intelligence) that maps skill distributions across companies, industries, and geographies
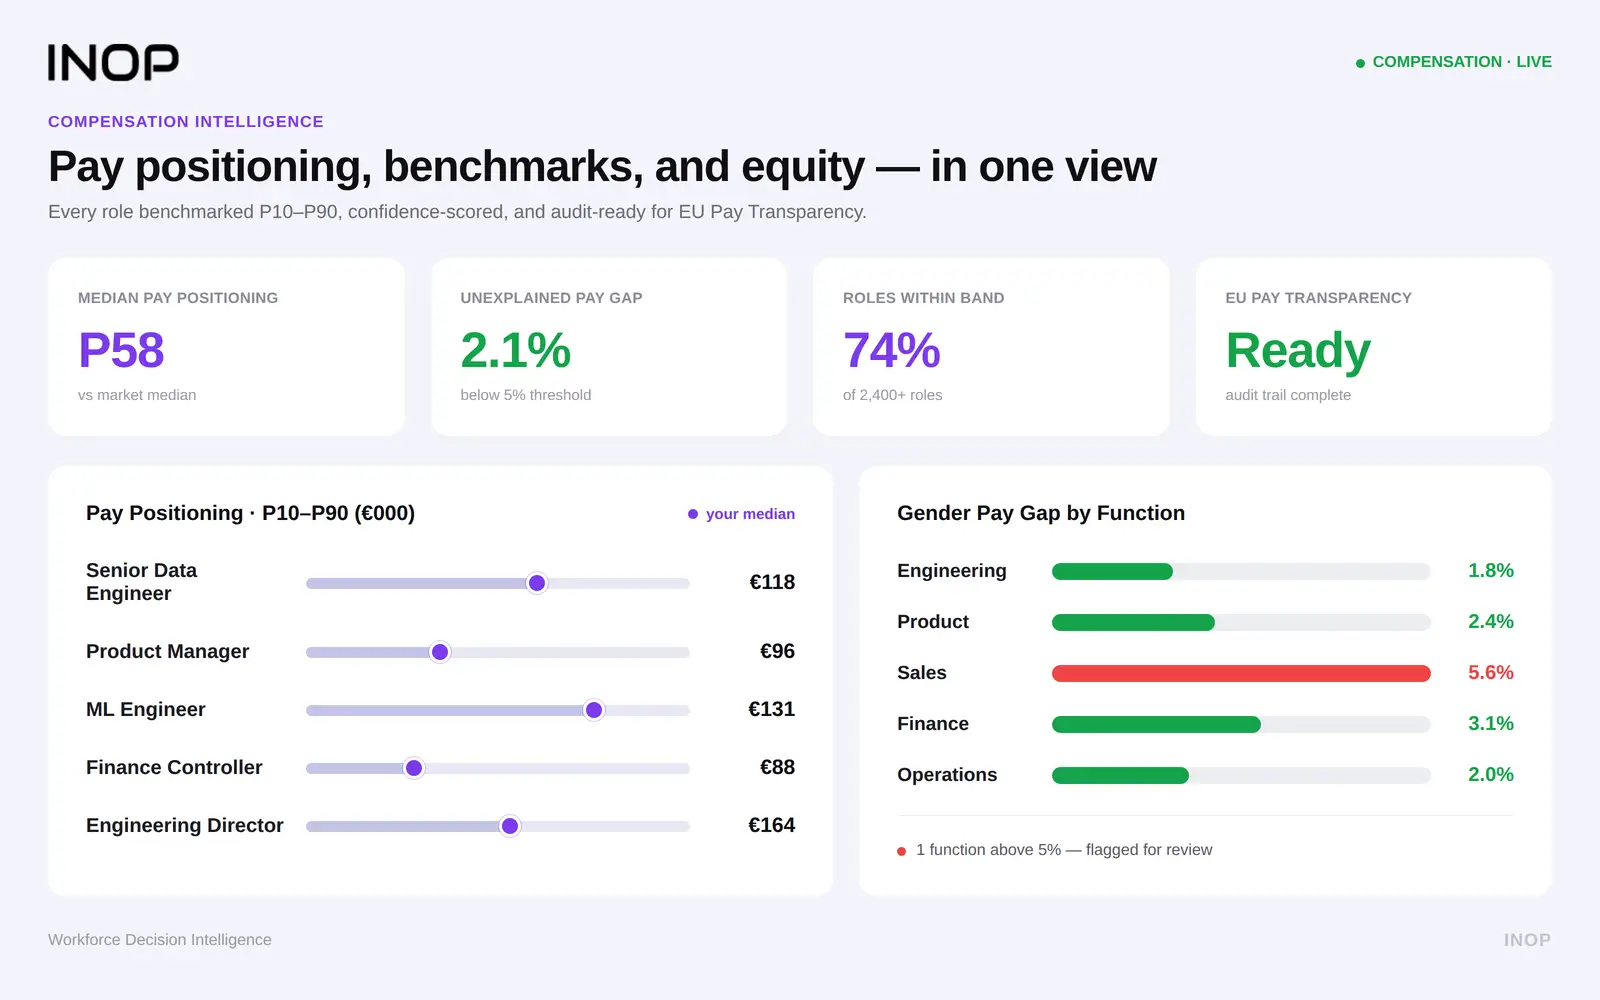
- Industry salary surveys and compensation benchmarks, which reveal where competitors are paying premiums, a reliable proxy for which skills they consider strategically critical
- Talent flow analysis, tracking where employees are moving to and from, which exposes capability strengths and vulnerabilities at competitor organisations
Platforms built for strategic workforce planning typically integrate multiple external data streams to surface this intelligence continuously, rather than relying on point-in-time surveys.
Interpreting the Gap: From Data to Decision
The analysis phase is where most skills mapping efforts stall. Organisations produce beautifully detailed gap reports, then struggle to translate them into anything resembling a plan. The reason is usually that the gap data has not been connected to business priorities or a decision framework that forces choices.
Classifying Gaps by Strategic Urgency
Not all skill gaps are equal. Once you have benchmarked your internal capabilities against both your strategic needs and external competitors, you can classify gaps across two dimensions: how critical the skill is to business performance and how severe the gap is relative to the market.
This creates four distinct categories:
- Critical and severe: These represent the greatest strategic risk and require immediate, multi-pronged response.
- Critical and moderate: Gaps in skills that matter greatly, but where you are not significantly behind the market. Targeted development and selective hiring can close these efficiently.
- Tactical and severe: Skills where your deficit is large but the business impact is lower. Often addressable through targeted recruitment or upskilling over a 12-24 month horizon.
- Tactical and moderate: Lower priority gaps manageable through standard L&D investment and internal mobility.
Applying the BBRA Decision Framework
Once you have classified your gaps, the question becomes: how do you close them? This is where a structured decision model prevents the default reflex of simply hiring externally for everything.
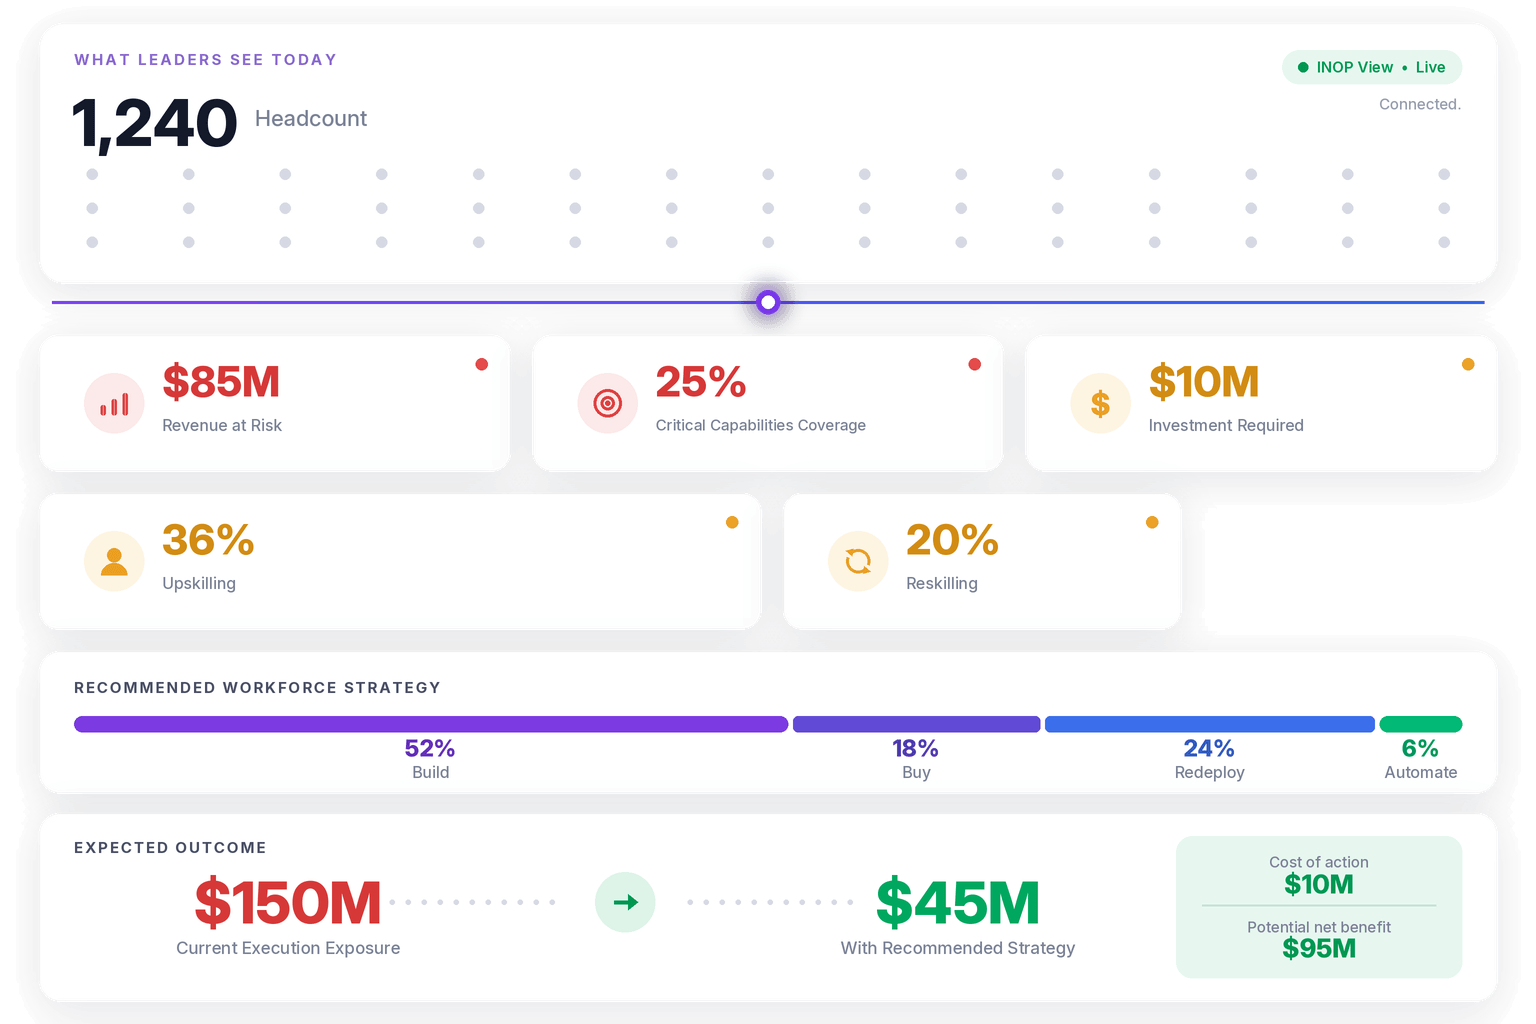
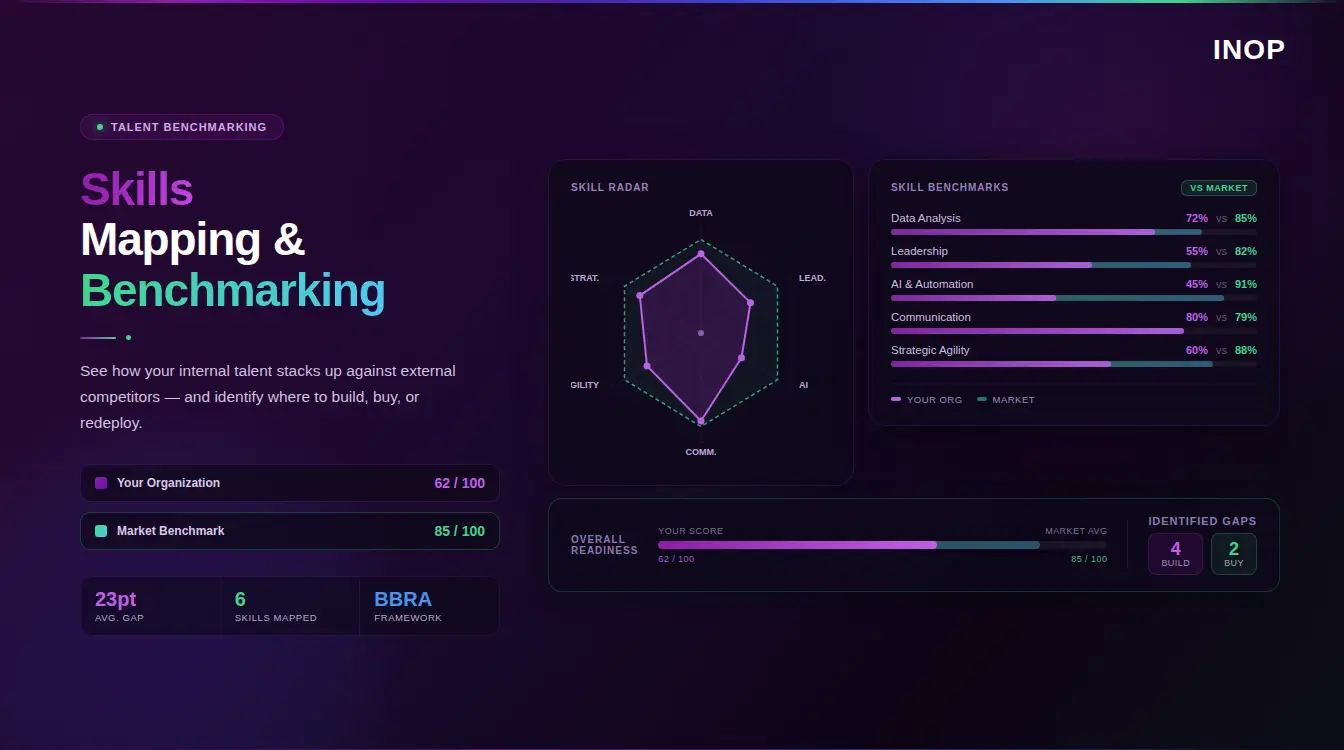
The BBRA framework provides four strategic levers:
Build: Invest in developing the skill internally. This is most appropriate when the capability can be cultivated within 6-18 months, when developing it strengthens broader team capability, and when the organisation has the infrastructure to support the learning journey.
Buy: Acquire the skill by hiring externally. Best applied when the gap is immediate, the skill is highly specialised, and the time required to build it internally would create unacceptable business risk.
Redeploy: Identify employees elsewhere in the organisation who already hold the skill and move them toward the area of need. This is one of the most underutilised levers in most organisations, largely because few have the visibility to know who holds what capability across the business. Mature skills mapping makes internal mobility possible in a way that reactive hiring never can.
Automate: Evaluate whether the skill gap can be partially or fully addressed through automation, AI tools, or process redesign. In some cases, the most strategic response to a gap is not to close it with human capability at all, but to redesign the process so the dependency is reduced or removed.
Applying BBRA to your prioritised gap list transforms skills mapping from an analytical exercise into an investment and deployment plan with clear cost and risk logic attached to each decision.
Skills Mapping Examples by Department: What It Looks Like in Practice
Abstract methodology is easier to apply when illustrated by concrete examples. The following three department-level examples show how the skills mapping framework adapts to different functional contexts while maintaining the same underlying structure.
Skills Mapping for a Data and Analytics Team
For a data and analytics function, the skills taxonomy divides naturally into three clusters: technical data skills (SQL, Python, statistical modelling, machine learning), data communication skills (data visualisation, insight narrative, executive presentation), and domain knowledge (the business area the team serves — finance, marketing, operations, or equivalent). A skills map for this function would reveal, for example, that the team has strong SQL depth but shallow machine learning capability, advanced data visualisation but weak executive communication, and good marketing domain knowledge but limited finance literacy. Each of those findings maps to a different BBRA response: the ML gap may be a Build or Buy decision depending on timeline; the communication gap is almost certainly a Build decision through coaching and structured practice; the finance literacy gap may be a Redeploy decision if finance-domain knowledge exists elsewhere in the organisation.
Skills Mapping for a Sales Function
Sales skills mapping separates differently from technical function mapping because the capability that produces results is a combination of product knowledge, commercial skills, and relationship capabilities. For a B2B technology sales team, the critical skills map might include product and solution knowledge, industry and vertical expertise, discovery and needs analysis, commercial negotiation, account expansion and renewal management, and CRM data quality. A gap analysis on this team frequently reveals that discovery skills and CRM discipline are the two capabilities with the widest variance between top performers and median performers. That finding directly shapes coaching investment: rather than generic sales training, the organisation invests specifically in structured discovery methodology and CRM accountability, which are the skills that close the performance gap between the median and the top.
Skills Mapping for an HR Function
HR skills mapping is one of the most underinvested applications of the methodology, partly because HR functions rarely apply to themselves the rigour they apply to other functions. A skills map for a modern HR team would include people analytics and data literacy, employment law and compliance knowledge, organisational design and change management, talent acquisition and assessment methodology, learning and development design, and business partnering and commercial acumen. The gap that appears most consistently in HR function mapping is commercial acumen and data literacy: HR professionals who are strong on process and legal compliance but weak on the quantitative and commercial skills required to participate credibly in strategic business conversations. That gap is why many HR functions are positioned as operational support rather than strategic partners, and skills mapping makes it visible rather than leaving it as a vague sense that HR needs to be more strategic.
Common Mistakes That Undermine Skills Mapping
Even well-resourced teams get this wrong. These are the failure modes to watch for.
Treating it as a one-time project: Skills mapping done once and filed away is close to worthless. The labour market moves continuously. Your strategy shifts. People leave, join, and develop. The skills map has to be a living system, not a project deliverable.
Relying entirely on self-assessment: Unvalidated self-reported skills data is unreliable. An employee who rates themselves as an advanced Excel user may have never built a dynamic financial model. Skills data needs calibration against observable output.
Mapping skills in isolation from business strategy: The most common version of this mistake is building an impressive skills inventory that no one uses because it was never connected to what the business actually needs to execute. The taxonomy, the benchmarks, and the gap analysis all have to be grounded in your strategic priorities.
Ignoring skill decay: Skills depreciate. A certification earned three years ago in a fast-moving technology domain may represent significantly less current competency than the profile suggests. Build decay assumptions into your model.
Underinvesting in data quality: Garbage in, garbage out. A skills map built on inconsistent, incomplete, or outdated data will generate misleading insights and poor decisions.
The Role of Technology in Modern Skills Mapping
A decade ago, skills mapping meant spreadsheets, competency matrices, and annual review cycles. That approach cannot keep pace with the speed at which the capability landscape now changes.
Modern skills intelligence platforms change the equation in several ways. They can ingest data from multiple HR systems simultaneously, removing the manual aggregation burden. They use AI to infer skills from work history, project involvement, and performance data, reducing reliance on self-assessment. They connect internal capability data to live labour market signals, making external benchmarking continuous rather than periodic.
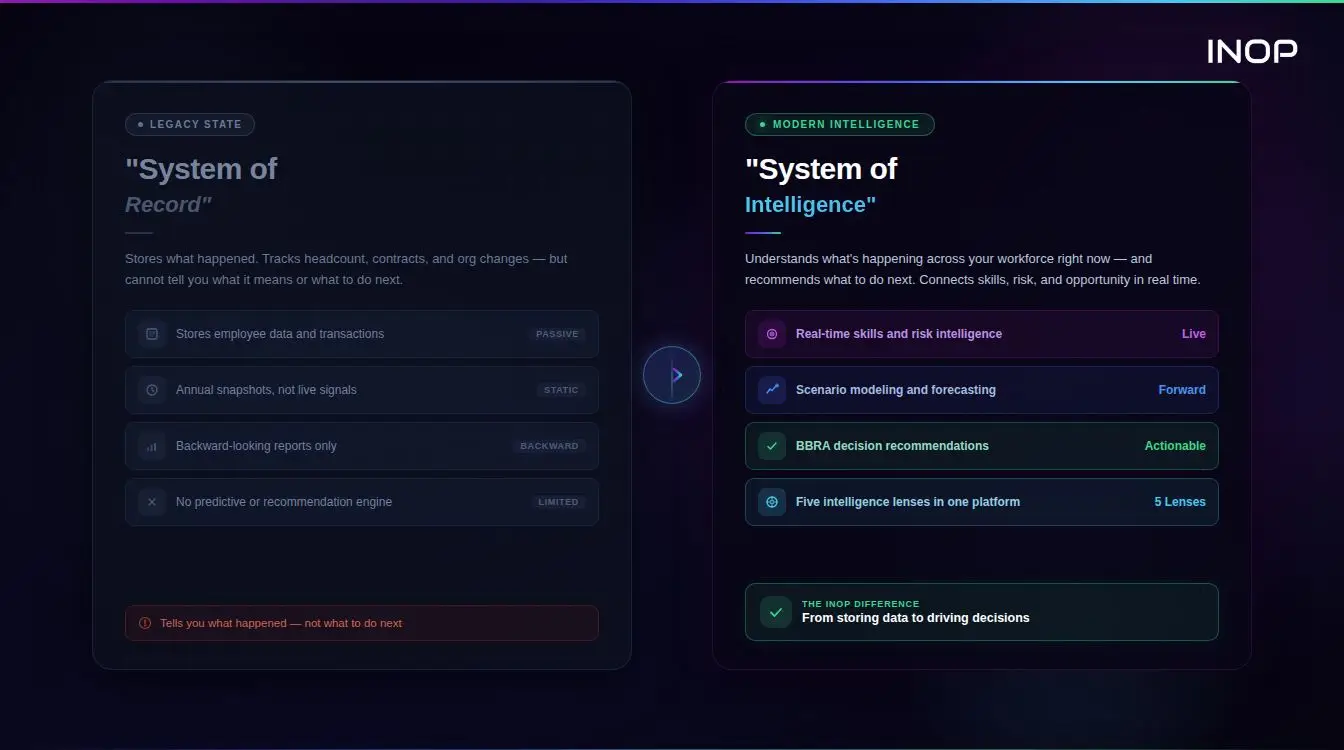
Critically, the most effective platforms do not analyse skills in isolation. INOP, for example, examines workforce capability through five lenses simultaneously: Strategy, Finance, People, Market, and AI/Automation risk. This matters because a skill gap means something very different depending on whether it carries high financial cost, sits in a scarce external talent market, or is on a trajectory toward automation. A gap in a role with all three characteristics demands a very different response than one with only one. That kind of multi-dimensional analysis is what separates workforce intelligence from workforce reporting.
Analysis of workforce intelligence deployments across INOP’s client base indicates that organisations with mature skills-based workforce planning capabilities report 98% higher internal mobility rates and significantly faster time-to-productivity for new hires, compared to those relying on periodic skills audits and manual gap analysis.
The technology does not replace the strategic judgement of HR leadership. It makes that judgement better informed and faster.
Closing the Loop: Connecting Skills Mapping to Learning Systems
The most common failure in skills mapping implementations is the gap between identifying a capability deficit and delivering the learning that addresses it. The assessment reveals that 40% of the sales team lacks advanced negotiation skills. The finding is documented in the skills map. Nothing happens, because nobody built the connection between the gap identification in the skills system and the course enrollment process in the LMS.
The technology connection that closes this loop is a bidirectional integration between the skills intelligence platform and the learning management system. When a gap is identified and prioritised, the integration should automatically surface relevant learning resources from the LMS, generate a suggested development pathway for the affected employee, and track completion back against the gap to update the skills profile when the learning is completed and applied.
This bidirectionality matters in both directions. Skills data flowing into the LMS makes learning recommendations personalised to actual gaps rather than generic catalogue browsing. Learning completion data flowing back into the skills system keeps the profile current without requiring manual re-assessment for every development activity. An employee who completes an advanced SQL certification should have their skills profile updated automatically, not wait for the next annual review cycle to reflect a capability they now demonstrably hold.
The practical requirement when selecting skills mapping technology is therefore not just whether the platform maps skills well, but whether it integrates with the learning systems your employees actually use. A skills intelligence platform that identifies gaps accurately but cannot connect to your LMS to route development creates a manual handoff that typically does not survive contact with day-to-day operational reality.
Skills Mapping and the CHRO’s Strategic Agenda
For chief human resources officers specifically, skills mapping is not just an HR operational matter. It is the foundation of everything else on the strategic agenda.
Workforce planning cannot be done credibly without knowing your current capability baseline and how it compares to where your strategy needs to go. The connection between skills intelligence and strategic workforce planning is direct and indivisible: one without the other produces plans that are either internally inconsistent or disconnected from market reality.
Succession planning depends on knowing which internal candidates have the skills, or the adjacent capabilities, to step into critical roles. Without a reliable skills map, succession plans are based largely on gut feel and proximity to leadership rather than verified capability.
Total rewards and compensation strategy benefits from knowing which skills your competitors are paying premiums for. If the market has begun valuing a particular capability set 20-30% above base, that is both a retention risk and a recruitment signal that your current compensation model may not be capturing.
Organisational design becomes more precise when you can see where capability concentration sits, where skill breadth is thin, and where automation is creating opportunities to redesign roles around human strengths rather than tasks that will be absorbed by technology.
L&D investment becomes dramatically more focused when it is directed by a skills gap analysis tied to business strategy, rather than by historical training patterns or manager preferences.
The CHRO who can walk into a board conversation with a clear view of the organisation’s current skills landscape, a benchmark against the external market, and a prioritised gap-closing plan tied to business outcomes is operating at a fundamentally different level than one working from intuition and anecdote.
Conclusion
Skills mapping is not a project. It is a capability. And like any capability, it has to be built, maintained, and continuously improved.
The organisations gaining competitive ground on talent right now are those that have moved beyond the idea that workforce intelligence is an HR function. They treat it as a business intelligence function, one that connects directly to strategy, finance, and execution risk. They map their internal capabilities with rigour, benchmark against the external market without complacency, and use frameworks like BBRA to make deliberate, evidence-based decisions about how to close the gaps that matter most.
The WEF Future of Jobs Report 2025 makes clear that the scale of required workforce transformation is not incremental. The CHROs who are ready for that moment are the ones building their skills mapping and benchmarking infrastructure now, not when the pressure is already acute and the options have narrowed.
If you are ready to move beyond periodic skills audits toward a continuous, intelligence-driven capability view, speak with the INOP team to see how the platform maps your workforce across the five lenses of Strategy, Finance, People, Market, and AI/Automation risk, and turns that analysis into clear workforce investment decisions.
Frequently Asked Questions
What is the difference between skills mapping and competency frameworks?
A competency mapping framework defines what capabilities a role or level within the organisation should have. Skills mapping assesses what capabilities your people actually have and compares those against the framework requirements. Both are valuable, but they answer different questions. Competency frameworks define the standard; skills mapping measures the gap between the standard and reality.
How often should we update our skills map?
In fast-moving industries, the underlying data should be refreshed continuously, with structured review cycles quarterly for critical capability areas and semi-annually for the broader organisation. In more stable sectors, bi-annual comprehensive reviews with continuous data updates represent a reasonable baseline. The key principle is that the skills map should reflect your current workforce, not the workforce you had at the time of your last HR cycle.
How do we handle employee privacy concerns around skills data collection?
Transparency is essential. Employees should understand what data is being collected, how it will be used, and who has access to it. The framing matters significantly: skills mapping positioned as career development intelligence is received very differently from skills mapping positioned as a performance surveillance tool. Involving employees in building and validating their own skills profiles increases both accuracy and trust.
Is skills mapping only relevant for large enterprises?
The principles apply at any scale. Smaller organisations may lack the resources for enterprise-grade platforms, but the underlying practice, defining a skills taxonomy, validating current capabilities, and benchmarking against market demand, can begin with structured conversations and relatively simple tooling. The ROI is often higher for smaller organisations because there is less redundancy to absorb the impact of capability gaps.
What role does AI play in modern skills mapping?
AI accelerates and scales the process in several ways: inferring skills from work history and project data rather than relying entirely on self-assessment, matching internal skills profiles to labour market signals automatically, identifying adjacent skills that make an employee a strong candidate for reskilling, and flagging skills at risk of obsolescence based on market trends. The human judgement of HR leadership remains essential for interpreting the data and making decisions, but AI reduces the data collection and analysis burden substantially.
How do we connect skills mapping findings to workforce investment decisions?
The BBRA framework provides a practical structure for this. Once you have identified and prioritised gaps by strategic urgency, each gap is evaluated against four levers: Build (develop internally), Buy (hire externally), Redeploy (move existing talent), or Automate (reduce the human dependency). Attaching a cost and risk estimate to each option, and tying the decision to business outcome metrics, is what converts the skills map from an analytical document into a workforce investment plan.
How do we benchmark against competitors who are not disclosing their skills data?
You do not need competitors to self-disclose. Labour market data platforms aggregate skills signals from job postings, which reveal what capabilities organisations are actively seeking. Professional network data shows skill distributions at competitor organisations. Salary data reveals which skills are attracting premiums, which is a reliable proxy for strategic importance. Talent flow analysis tracks where employees are moving to and from. Together, these external signals build a reasonably accurate picture of competitor capability investment without requiring any direct disclosure.
Book a Demo
Make confident workforce decisions that support strategy and value creation.