Labour market insights are one of the most powerful inputs available to HR leaders, CFOs, and boards navigating workforce strategy. When used well, they answer questions that internal data alone never can: which skills are rising in market value and which are declining, where talent supply is tightening, what competitors are building in house, and how AI and automation are reshaping the roles your organisation depends on.
The organisations that use labour market intelligence effectively do not just benchmark salaries. They use external signals to stress-test strategy, anticipate capability gaps before they become execution risks, and make workforce investment decisions with the same financial rigour applied to capital allocation.
This article explains what high-quality labour market insights actually deliver, where the structural limits of generic data create risk, and how INOP’s workforce intelligence platform extends labour market intelligence into the broader market context that drives the most consequential workforce decisions.
What Labour Market Insights Actually Tell You
At their best, labour market insights provide a continuously updated picture of the external environment your workforce strategy operates within. That picture has several distinct dimensions.
Skills supply and demand signals tell you which capabilities the market is pricing up, which are commoditising, and where scarcity is real versus perceived. For a CHRO planning a talent acquisition or development programme, understanding whether the skill you need is abundant or genuinely scarce in your hiring markets changes every assumption in the business case.
Trending, emerging, and declining skills give you a forward-looking read on where capability value is moving. A skill that is in high demand today may be significantly automated in 18 months. A capability that looks niche now may become strategically critical as your sector shifts. Labour market signals, when read with sufficient granularity, surface these trajectories before they show up in your internal skills gap data.
Competitive landscape intelligence is one of the most underused dimensions of external market data. Understanding what skills your direct competitors are hiring for, where they are investing in capability development, and where they are redeploying or reducing headcount gives you a genuine strategic edge. Workforce composition is a signal of strategic intent, and the organisations that read it systematically make better positioning decisions.
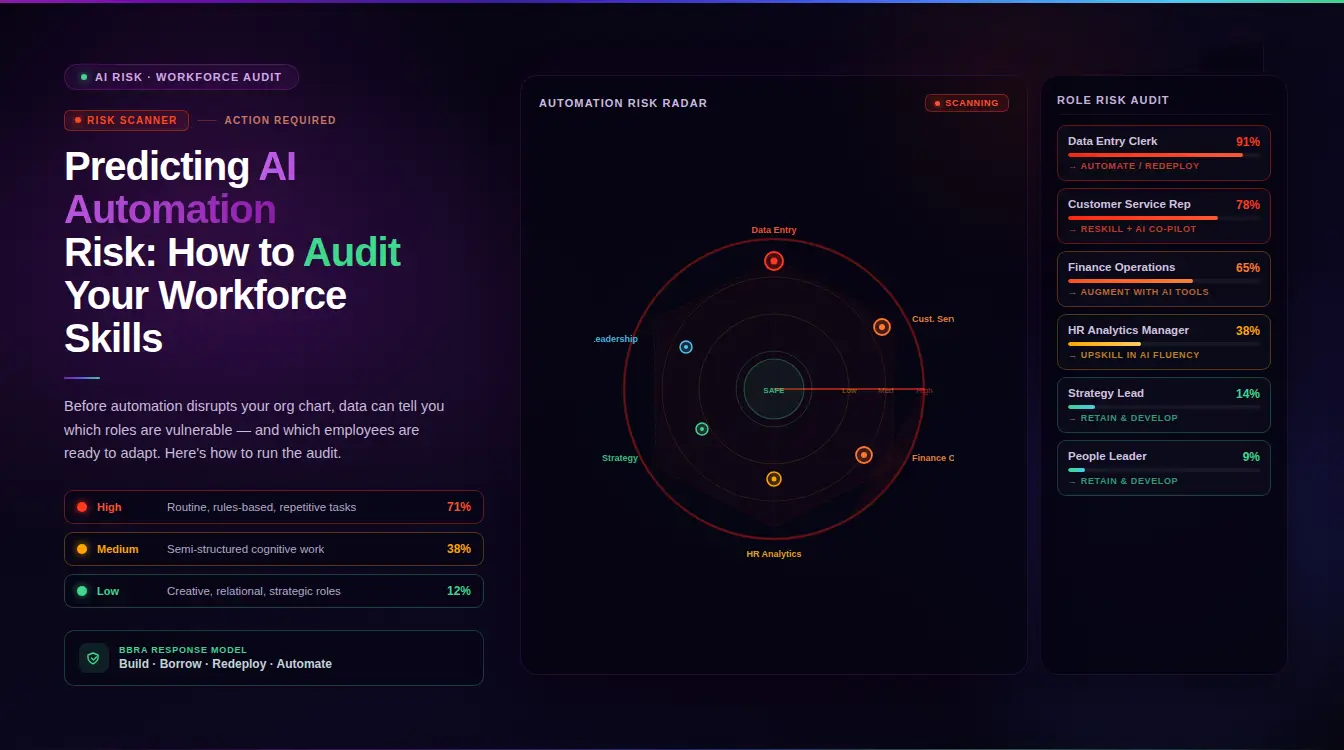
AI and automation impact on skills is now inseparable from any serious labour market analysis. As AI reshapes task composition across roles, the skills profile of many functions is changing faster than traditional workforce planning cycles can track. Labour market data that captures how automation is affecting role structures, which task clusters are being displaced, and which new skill adjacencies are emerging gives organisations the intelligence to act ahead of disruption rather than respond to it.
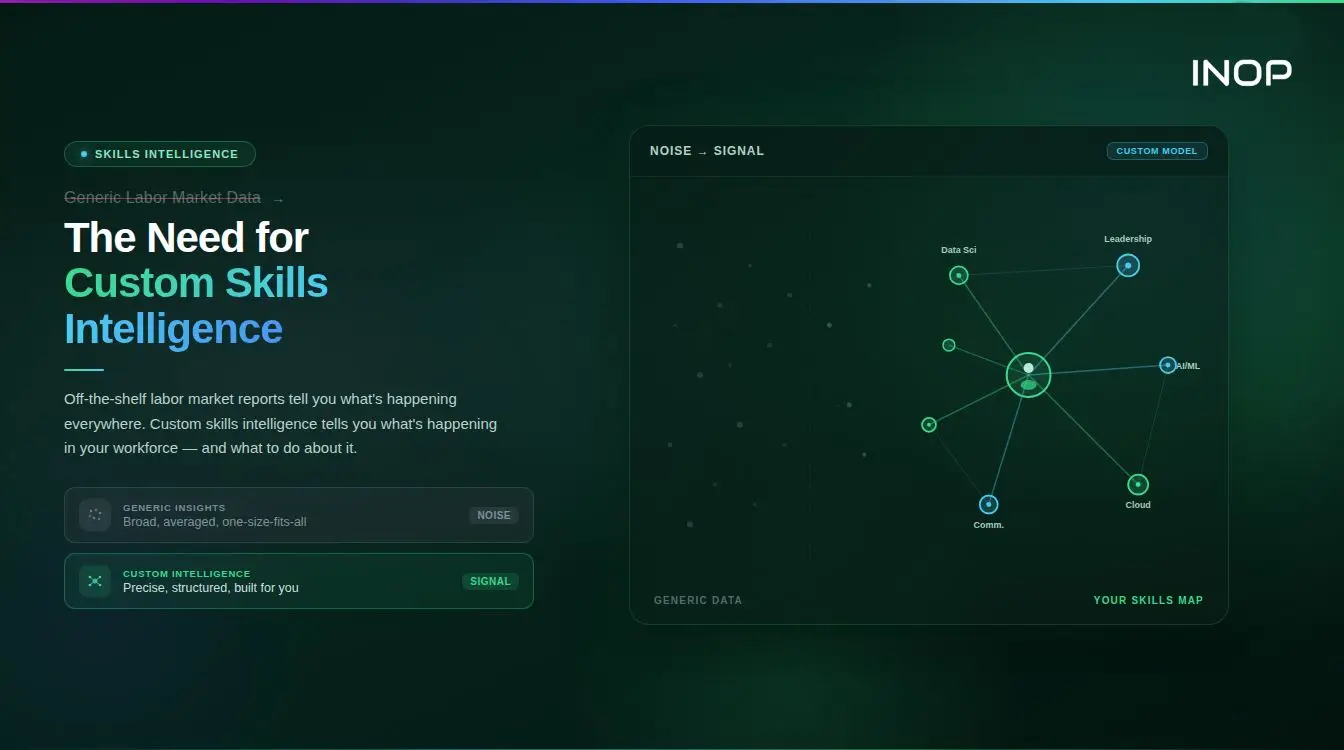
Where Generic Labour Market Data Has Structural Limits
Understanding what labour market insights deliver makes it easier to see where generic data, published benchmarks and aggregate reports, creates risk if relied on exclusively.
The industry average problem. Sector-level benchmarks reflect the central tendency of a large, heterogeneous population. Your organisation is not the average. Its competitive position, talent brand, geographic footprint, and strategic ambitions are specific. National average compensation data may be accurate for the sector as a whole and meaningfully wrong for your particular combination of role, location, and employer brand.
The lag problem. Most published labour market data carries a six to twelve month lag between research and publication. In a market where skills demand can shift within a quarter, decisions anchored to last year’s data carry a structural competitive disadvantage. Organisations that rely on lagging data make compensation decisions that are already behind the market and prioritise skills in development programmes that the market has already started pricing down. Many compound this problem by anchoring their workforce planning to foundational frameworks such as O*NET, ESCO, or national occupational classifications, which are updated on multi-year cycles and were never designed to capture the velocity of skills change driven by AI and automation reshaping role and skill composition in real time.
The inside-out blind spot. External data tells you what the market looks like around your workforce. It cannot tell you what skills already exist inside it, where capability is concentrated or dangerously thin, or where internal talent could be redeployed to close a gap you are currently planning to fill externally at significant cost. Only 26% of HR leaders say they have a robust skills taxonomy in place to guide workforce planning, according to Deloitte’s 2024 Human Capital Trends research. Without that internal inventory, organisations are navigating with half a map.
The World Economic Forum estimates the global skills gap costs $8.5 trillion annually in lost productivity. 87% of organisations report current or anticipated talent shortages. Korn Ferry projects a global shortfall of 85 million workers by 2030. These numbers create urgency. But urgency without specificity does not create action. Action requires knowing what the gap looks like inside your organisation, not just across the sector.
Beyond Labour Market Data: INOP’s Market Intelligence Layer
INOP’s Market lens goes significantly further than conventional labour market data. Where most workforce intelligence platforms stop at skills supply and demand benchmarks, INOP’s Market lens captures the full external context that shapes workforce decisions at the board level.
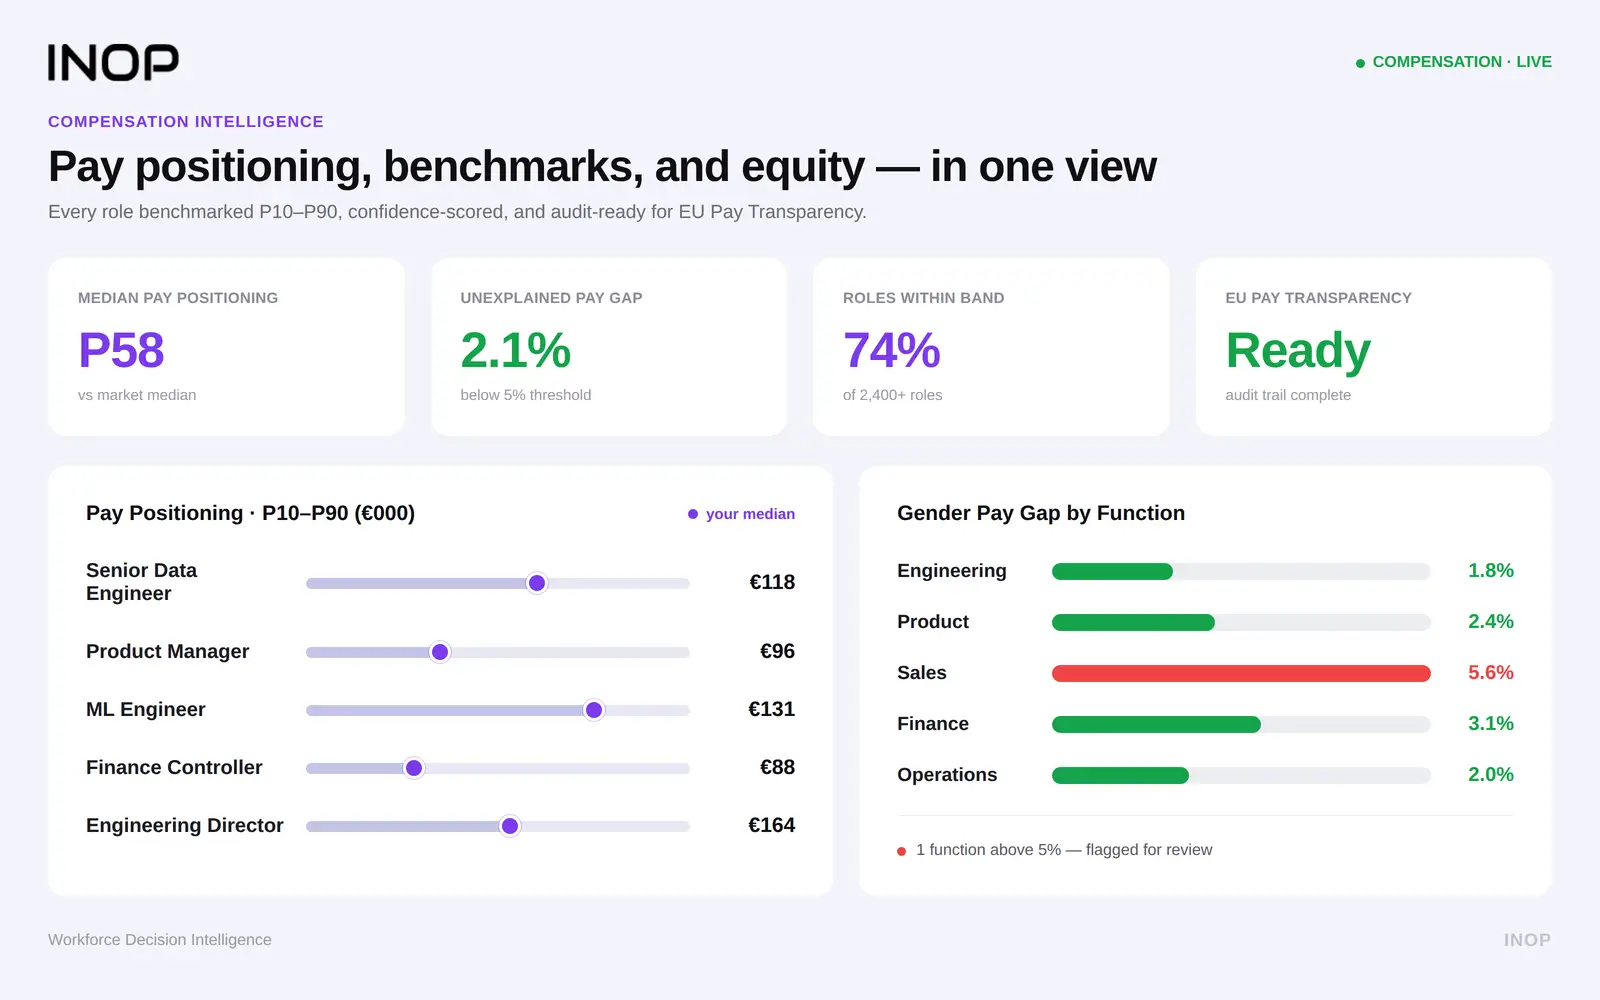
This means labour market signals are analysed alongside regulatory frameworks and compliance requirements that directly affect workforce composition and people investment decisions. The EU Pay Transparency Directive, evolving skills disclosure requirements, and sector-specific regulatory shifts are not HR administration issues. They are strategic variables that change what your workforce needs to look like and when.
It also means sector-specific developments are integrated into the workforce picture. Industry disruption, M&A activity in your competitive landscape, technology adoption curves in your sector, and shifting customer expectations all have direct workforce implications that generic labour market data does not capture. A skills gap that looks manageable against market benchmarks may look urgent when you understand the sector trajectory it sits within.
Competitive landscape intelligence is the third dimension that separates INOP’s Market lens from conventional labour market tools. Understanding what capabilities your direct competitors are building, where they are hiring, and where they are automating gives CHROs and strategy executives a view of workforce positioning that most organisations currently have no systematic way to access.
This is the layer where INOP’s intelligence answers the question boards and CFOs are actually asking: not just where is the talent market moving, but what does the full external environment mean for our workforce strategy?
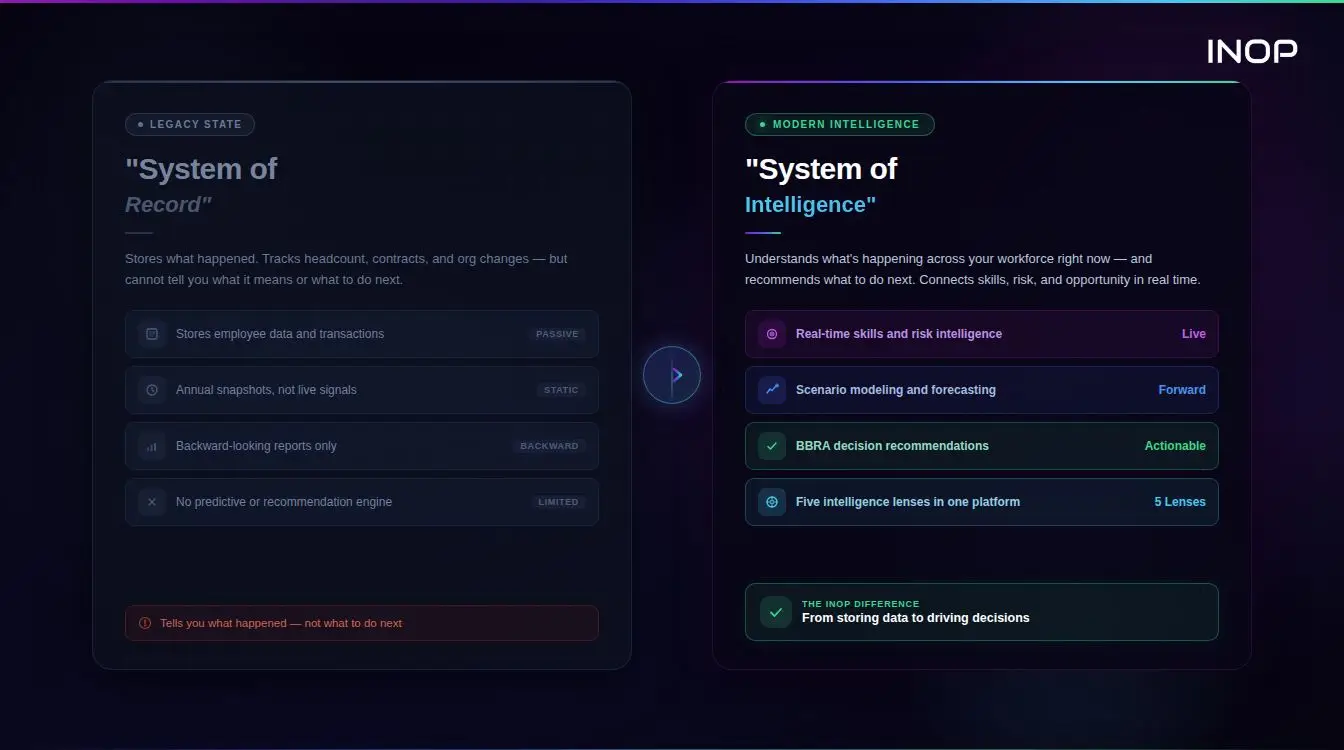
The Five Intelligence Lenses That Drive Better Decisions
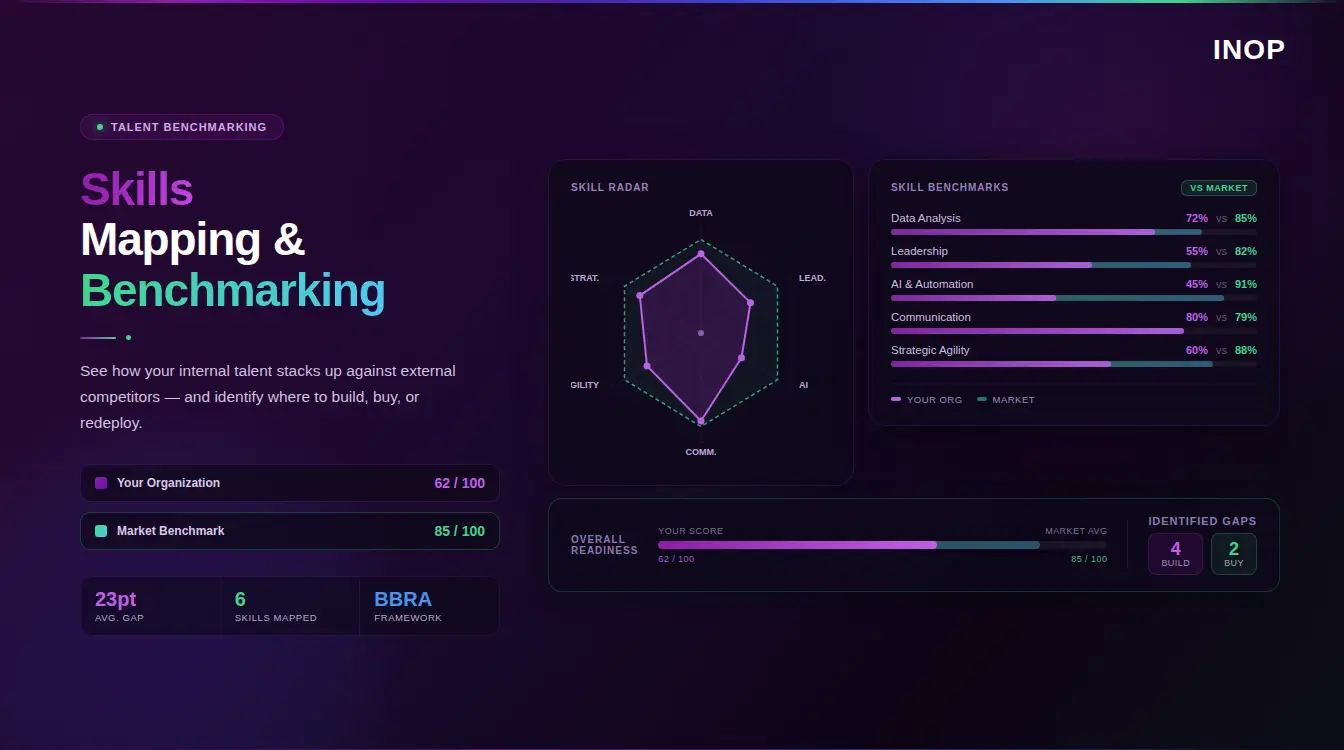
Labour market insights become transformational when they are not treated as a standalone input but as one of five analytical lenses working simultaneously. INOP’s workforce intelligence architecture is organised around exactly these five dimensions, and it is the intersection of all five that determines the criticality of roles, the materiality of skills gaps, and the right intervention for each situation.
Strategy lens. Workforce capability analysis anchored in your specific organisational strategy and execution priorities. This lens asks which capabilities your strategy depends on, over what timeline, and what the gap between current state and required state looks like in your specific context, not against an industry average.
Finance lens. The translation of capability gaps into financial exposure. Productivity loss from underperforming roles, vacancy cost from unfilled positions, execution risk from project delays, turnover cost from gap-related attrition, and innovation opportunity cost from capabilities you do not have and cannot acquire. Each of these has a quantifiable value that makes the workforce case in CFO language.
People lens. The internal skills inventory itself, covering proficiency depth, geographic and organisational distribution, concentration risk, and obsolescence trajectory. This is the inside view that no external data source can provide, and the layer that makes external market intelligence genuinely actionable rather than merely directional.
Market lens. Calibrated external intelligence spanning labour market supply and demand signals, skills trending and velocity, competitive landscape intelligence, regulatory and compliance requirements, and sector-specific developments. Not averages, but the specific market context your organisation actually competes within.
AI and Automation lens. Forward-looking assessment of which capability requirements are likely to shift as AI and automation change the task composition of roles. A gap that looks significant today may be materially reduced in 18 months as automation takes over portions of the work. This lens prevents organisations from over-investing in closing gaps that are in the process of being automated away, and identifies where new capability requirements are emerging faster than traditional planning cycles can track.
From Market Intelligence to Workforce Action: The BBRA Framework
Labour market insights and internal capability data only create value when they drive decisions. INOP’s BBRA framework, Build, Buy, Redeploy, and Automate, is the decision architecture that converts intelligence into action with a defensible financial return.
Build develops capability from within through structured learning and development investment. Critically, this is not generic L&D spend. Build in INOP’s framework means defining upskilling paths and investment costs for incumbents calibrated against the five lenses relevant to their specific roles: what the strategy requires, what the market values and cannot easily supply externally, which skills will remain critical beyond the automation horizon, and where current proficiency depth creates a realistic learning path. It also includes identifying incumbents who can be developed into roles that are harder to fill due to external scarcity, and backfilling their vacated positions with profiles more readily available in the market. That combination, moving the right people up and filling behind them with accessible talent, is often the most capital-efficient way to close a critical gap.
Buy brings capability in through external hiring. It is faster but significantly more expensive. SHRM data shows the average cost per hire now exceeds $5,000 before accounting for vacancy productivity loss, which for a $100,000 role runs at approximately $450 per day. Market intelligence calibrates Buy decisions by showing the realistic external supply for the skill you need, in the specific markets where you hire, at the actual cost your talent brand and location will command.
Redeploy identifies people elsewhere in your organisation whose actual capability profile, assessed through the five lenses, matches a critical gap. The people lens surfaces where capability is underleveraged. The market lens confirms where that capability is scarce externally. The strategy and finance lenses determine the criticality and cost of leaving the gap open. Without robust internal skills intelligence and role value analysis this option is invisible. With it, it is often the fastest and most cost-effective path to closing a gap.
Automate evaluates whether a technology-enabled process can replace a human capability requirement, either eliminating the gap or freeing capacity for higher-value work. The AI and Automation lens provides the analytical foundation for this decision, ensuring Automate is evaluated based on realistic automation trajectory rather than vendor claims.
What This Looks Like in Practice
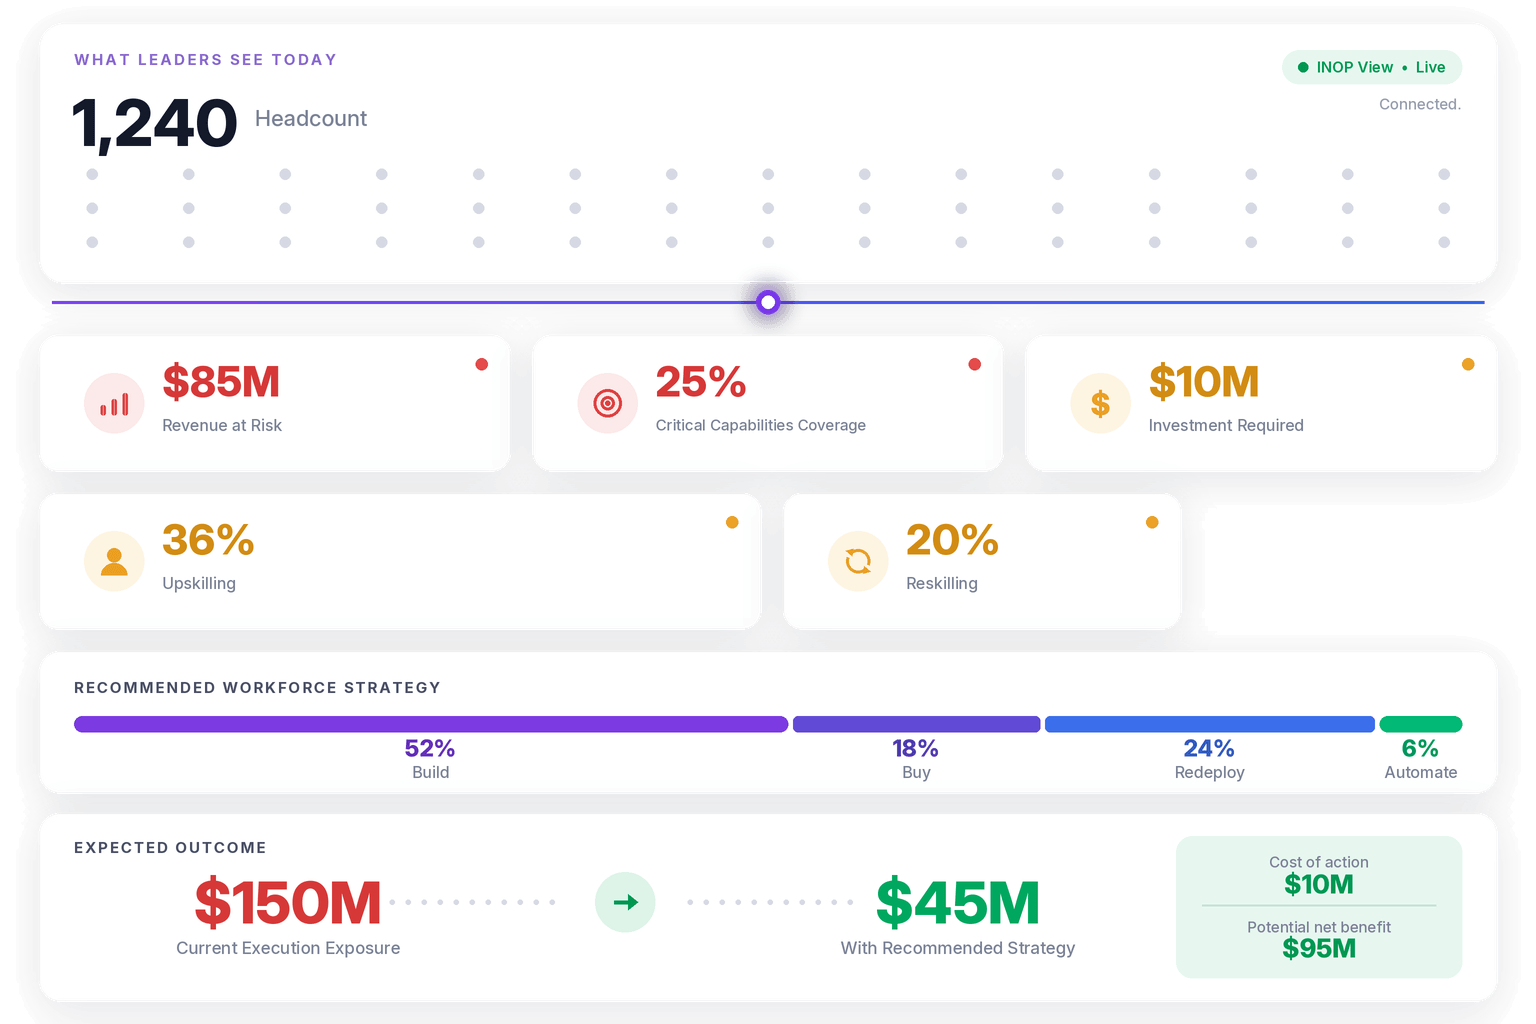
A renewable energy company facing a major capital programme came to INOP with three questions: do we have the right skills and quality of people to execute, what will it cost to close the gaps we have, and what is the materiality impact if we do not act.
The analysis identified a do-nothing workforce execution risk in the hundreds of millions. Applying the BBRA framework reduced that exposure by approximately 45% through targeted workforce action: defining upskilling paths and investment costs for incumbents calibrated against the five lenses relevant to their roles, identifying which capabilities the strategy required, what the market valued and could not easily supply externally, and which skills would remain critical beyond the automation horizon. Incumbents on those development paths backfilled into positions more readily available in the market, and internal talent identified through the people and market lenses as critically underleveraged was redeployed accordingly. Layering in automation across high-volume task clusters reduced exposure by a further 8%.
The structured intervention recommendations across the BBRA framework produced an estimated 11x return on investment against the cost of acting.
From Labour Market Insights to Workforce Intelligence: The Practical Transition
For many HR functions, the shift from consuming generic market data to operating a custom intelligence model feels large. It has a logical sequence.
Audit your current data inputs. Map what labour market data you currently use, how frequently it is updated, and which decisions it informs. Most organisations find they are using a small number of sources, often a single salary benchmarking tool and one or two published reports, to make a wide range of workforce decisions.
Build the internal skills map. Before you can overlay external market data meaningfully, you need the internal picture. This means moving beyond what your HRIS records toward an actual capability assessment at the role and individual level, capturing proficiency depth, not just skill presence.
Calibrate external benchmarks to your specific context. Filter your market data to the geographies, industries, and company-size bands that actually reflect your competitive environment. A national average that includes hyperscaler technology companies is misleading if you are a 3,000-person industrial firm competing for talent in regional markets.
Connect the dots to financial exposure. Map each material capability gap to its financial exposure across the cost domains that matter: productivity loss, vacancy cost, execution risk, turnover amplification, and innovation opportunity cost. Then model the cost of the chosen BBRA intervention against that exposure. An organisation that identifies a multi-million exposure from a capability gap and can close it for a fraction of that cost in targeted investment has a return case the CFO will engage with.
Why PE Operating Partners Need This Approach
Private equity operating partners are among the most financially disciplined consumers of workforce data, and the ones most likely to find generic labour market insights inadequate for their needs.
During due diligence and value creation plan execution, operating partners need to understand execution risk at the workforce level with the same precision they apply to financial modelling. Generic market data tells them what the talent landscape looks like broadly. It cannot tell them whether the portfolio company’s leadership capability is sufficient to execute a 90-day integration, or what the realistic cost and timeline of closing the capability gaps that stand between current performance and plan targets actually is.
INOP’s BBRA framework and five-lens intelligence architecture provide exactly this granularity, making workforce decisions as defensible as capital allocation decisions.
Frequently Asked Questions
What is the difference between labour market insights and workforce intelligence?
Labour market insights describe external market conditions: aggregate employment trends, sector-level compensation benchmarks, skills demand signals, competitive landscape data, and regulatory developments. Workforce intelligence combines that external picture with a precise internal capability assessment, organisational strategy context, and financial analysis to produce specific, actionable decisions. The distinction matters because external data tells you what the market looks like around your workforce. Workforce intelligence tells you what to do about it, and what it costs to do nothing.
Why are generic labour market reports insufficient for workforce planning?
Generic reports reflect averages across large, heterogeneous populations. Your organisation’s talent market, competitive position, geographic footprint, and strategic requirements are specific. Beyond the specificity problem, most published reports carry a six to twelve month lag. In a market where skills demand can shift within a quarter, decisions made on lagging averages carry structural competitive risk.
What is INOP’s BBRA framework and how does it connect to labour market insights?
BBRA stands for Build, Buy, Redeploy, and Automate. It is INOP’s proprietary decision framework for translating capability gap analysis into workforce action. Once labour market intelligence and internal skills data identify a gap and quantify its financial exposure, BBRA provides the structure for evaluating four distinct intervention paths, each with a different cost, timeline, and risk profile. Build includes upskilling paths calibrated against the five lenses and strategic backfill logic. Redeploy draws on role value analysis and internal capability mapping. Buy is calibrated against actual market supply and cost. Automate is grounded in realistic automation trajectory, not vendor claims.
What does INOP’s Market lens cover beyond standard labour market data?
INOP’s Market lens integrates labour market supply and demand signals with regulatory and compliance requirements, sector-specific developments, competitive landscape intelligence including what capabilities competitors are building, and broader macro signals relevant to workforce strategy. This gives boards and CFOs the full external context for workforce decisions, not just talent market benchmarks.
How often should a workforce intelligence model be updated?
The model should be treated as a live system rather than an annual deliverable. Skills profiles change as employees develop, depart, or are redeployed. External market conditions shift, sometimes significantly, within a single quarter. A model refreshed once a year is telling you where your organisation was, not where it is.
What internal data is needed to build a workforce intelligence model?
The core inputs are a skills inventory with proficiency depth, role-level performance data, organisational structure and reporting relationships, strategic workforce requirements derived from business planning, and compensation data. The integration challenge, connecting these sources into a coherent intelligence layer, is precisely what INOP’s platform is designed to solve.
How does workforce intelligence change the CHRO’s relationship with the CFO?
It changes the vocabulary of the conversation. Instead of presenting talent risk as a qualitative concern, a CHRO with workforce intelligence can quantify capability exposure in financial terms, model the ROI of specific interventions, and present workforce investment decisions using the same framework the CFO applies to capital allocation. That shift, from HR narrative to financial analysis, is what earns workforce strategy a genuine seat at the executive table.
Book a Demo
Make confident workforce decisions that support strategy and value creation.