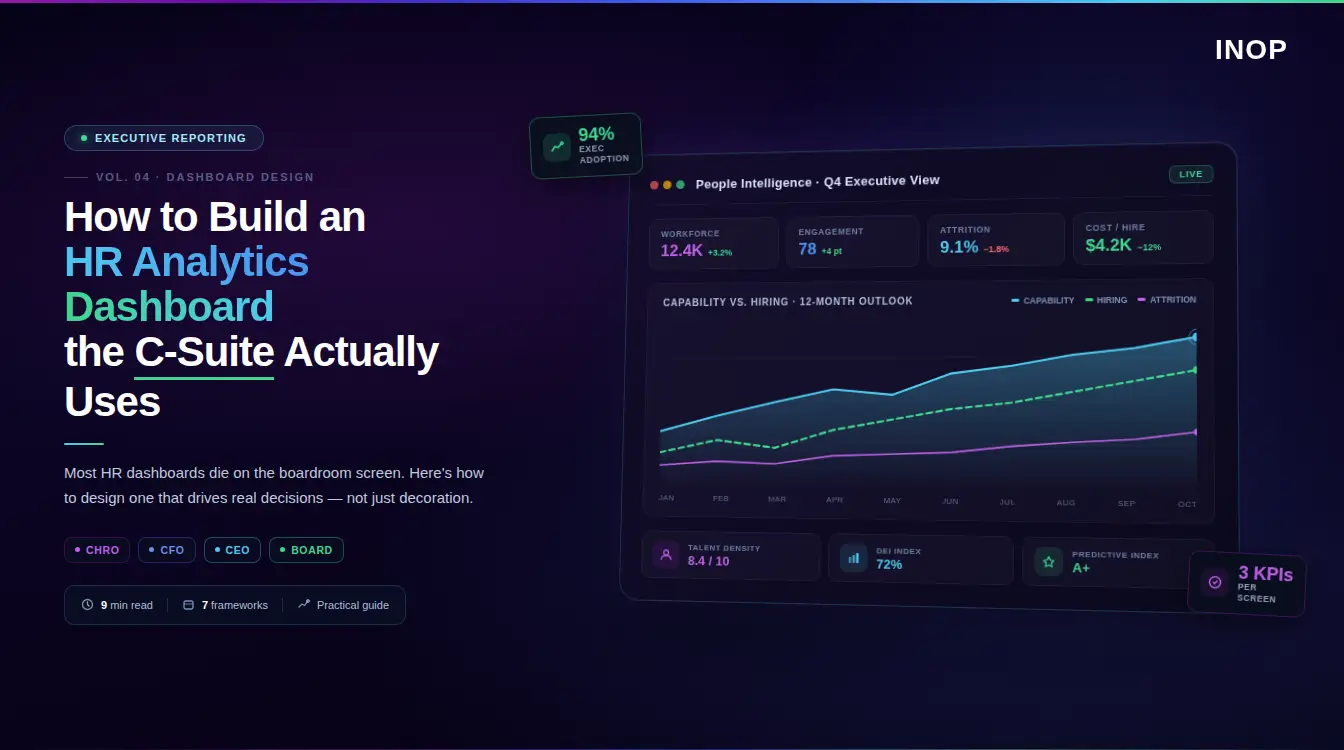
Most HR analytics dashboards never get opened twice. They are built by HR teams, for HR teams, and delivered to executives who quietly close the tab after the first glance. If you have ever spent weeks building a people metrics report only to watch it gather digital dust in a shared folder, you are not alone, and you are not the problem. The dashboard is.
An HR analytics dashboard that genuinely earns C-suite attention is not just a collection of charts. It is a decision instrument. It translates workforce reality into the language that matters at the top: cost, risk, growth, and execution capacity. This article will walk you through exactly how to build one, from the strategic foundation to the metrics architecture to the design and adoption principles that keep executives coming back. Whether you are a CHRO preparing for your next board review, a people analytics leader trying to earn a seat at the strategy table, or a PE operating partner assessing execution risk across a portfolio, this guide is for you.
Why Most HR Analytics Dashboards Fail the C-Suite
Before we talk about how to build the right dashboard, it is worth being honest about why so many wrong ones exist.
The core failure is one of translation. HR dashboards often report on HR activity, not business outcomes. They show time-to-fill, training completion rates, and headcount by department. These are metrics that are meaningful internally but that do not connect to the questions a CEO or CFO is actively wrestling with: Where is our execution risk? How much is turnover actually costing us? Are we investing in the right capabilities to deliver on our three-year strategy?
When a dashboard cannot answer those questions quickly and credibly, the C-suite stops looking at it.
There is also a frequency problem. Executives want workforce data surfaced regularly, in formats they can act on. The demand is real. The delivery, in most organizations, has not caught up.
Start With Business Strategy, Not With Data
The single most important step in building an HR analytics dashboard the C-suite will use has nothing to do with software. It happens before you open a single tool.
You need to understand what your executive leadership is actually trying to decide. Book 15 to 20 minutes with your CEO, CFO, COO, and key business unit heads. Ask them one question: What workforce question, if you had a clear and reliable answer to it right now, would make your biggest strategic decision easier?
Their answers will tell you exactly what belongs on your dashboard.
A CEO focused on market expansion will want to know if the organization has the capability to execute in new regions. A CFO managing cost pressure will want to understand where labor investment is generating returns and where it is not. A COO navigating a transformation program will want visibility into execution risk, specifically where critical skills are missing or concentrated in too few people.
This is the foundation of INOP’s decision-first approach: starting with the questions leaders need to answer and building the data layer backward from there, rather than collecting all available HR data and hoping executives find something useful in it.
Once you have captured those strategic questions, map each one to a metric, a data source, and an update frequency. That mapping becomes the architecture of your dashboard.
The Five Metric Domains That Belong on a C-Suite HR Dashboard
Not all HR metrics belong in front of the C-suite. The ones that do fall into five clear domains. These map directly to INOP’s five intelligence lenses: Strategy, Finance, People, Market, and AI/Automation. Together, they form the connective tissue between workforce data and business outcomes.
Workforce Capacity and Execution Risk
The C-suite cares deeply about whether the organization can actually deliver on what it has committed to. This maps to the Strategy lens: does today’s workforce supply match the demand implied by the operating plan? Your dashboard needs to surface workforce capacity by function, critical role vacancy rates, and capability concentration risk, specifically how many of your high-stakes capabilities sit in just one or two individuals.
A useful benchmark: if more than 40% of a critical capability is concentrated in fewer than three people, that is a material execution risk worth surfacing at the board level.
Talent Cost and Labor Investment Return
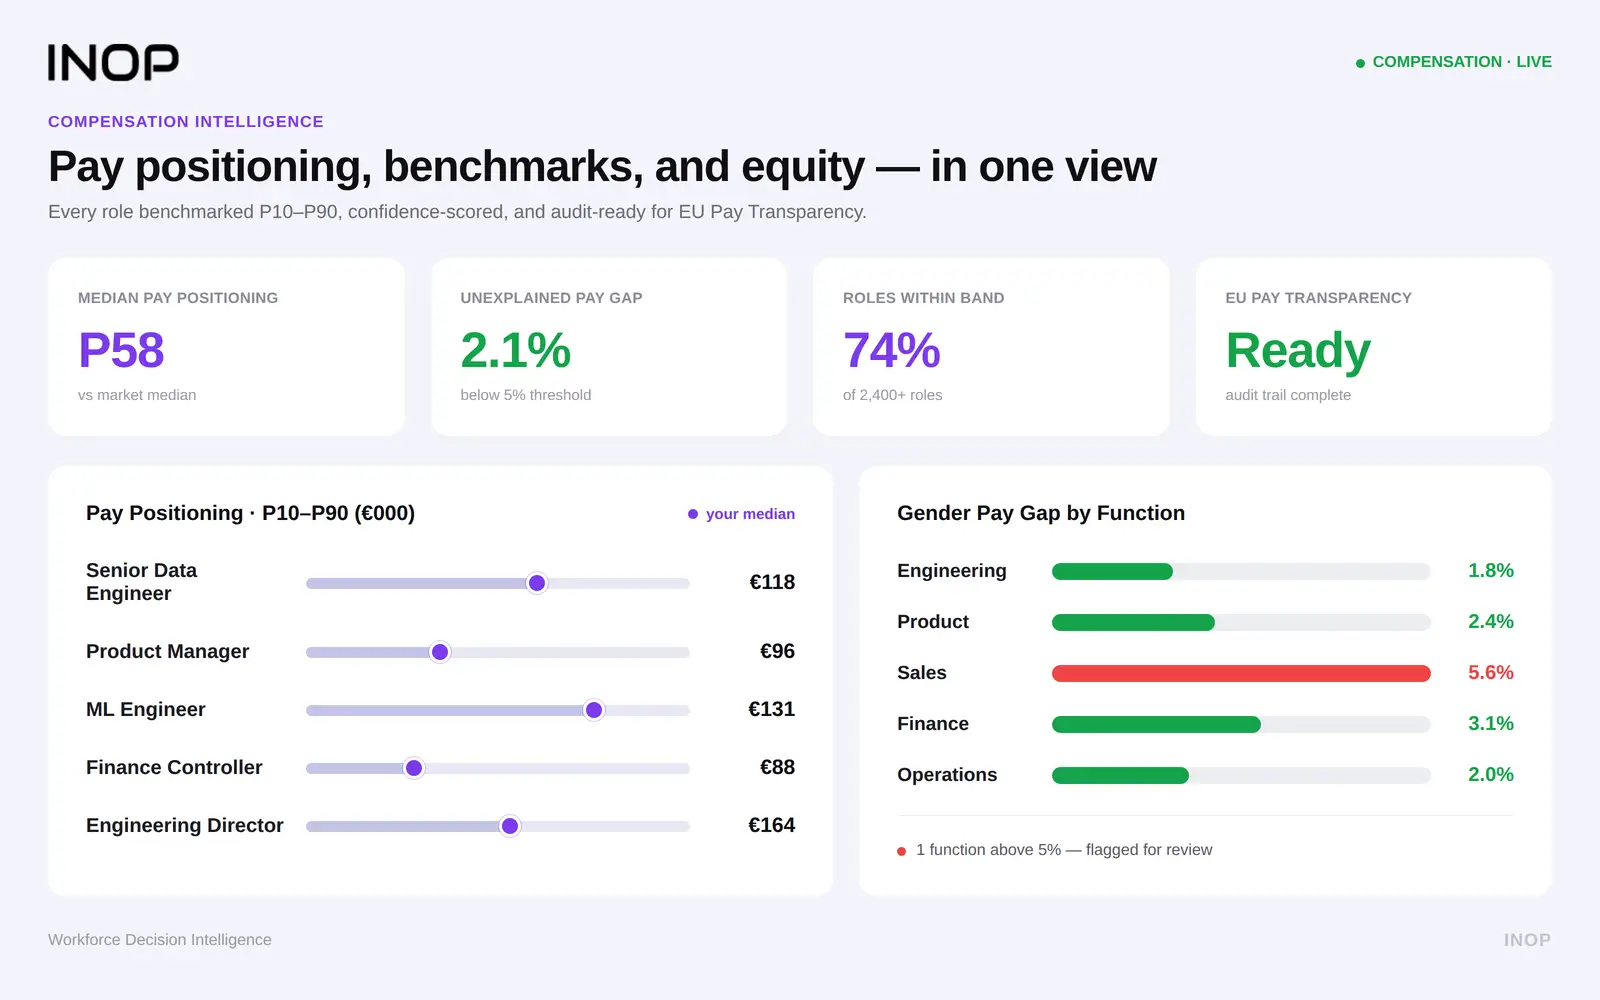
Your CFO does not want headcount numbers. They want to understand the financial logic of your workforce. This is the Finance lens in action. The metrics that matter here include cost per hire by role level and function, revenue per employee by business unit, regrettable turnover cost (calculated as 1.5x to 2x annual salary per lost senior employee), and total labor cost as a percentage of revenue tracked over time.
These figures translate HR data into the CFO’s native language and make the business case for investing in retention, development, and workforce intelligence infrastructure.
Skills Coverage and Capability Gaps
Skills intelligence is one of the fastest-growing areas of workforce analytics, and for good reason. This is where the People and Market lenses converge. When strategy shifts, the first question that should hit the CHRO’s desk is: do we have the skills to execute?
A skills coverage metric, expressed as the percentage of workforce with verified proficiency in capabilities critical to the next 12 months of strategy, gives the C-suite a direct line of sight into execution readiness. Pair this with a skills decay indicator. Skills in technology roles can become obsolete within a few years. If your workforce’s digital capabilities are aging faster than you are refreshing them, that belongs on the dashboard.
Most skills analytics tools stop at identifying the gap. The question that matters is what that gap is costing the business, and answering it requires connecting skills data to financial and operational context. That connection is what separates a skills gap report from a workforce intelligence capability.
Attrition Risk and Retention Intelligence
Most organizations measure turnover the way a forensic team arrives at a crime scene: after the damage is done. A C-suite HR dashboard should show predictive attrition risk by department, role level, and tenure cohort, not historical departure rates.
The goal is to surface risk 60 to 90 days before it materializes, giving leadership time to intervene. When you combine attrition risk with compensation data and engagement signals, you get a picture that is genuinely useful for resource allocation and retention investment decisions.
Workforce Planning Alignment
This is where strategic workforce planning connects directly to the dashboard. How well does today’s workforce supply align with the demand implied by next year’s operating plan? Are hiring pipelines tracking toward closing critical gaps? Where are internal mobility rates low enough that you are over-relying on external recruitment to fill strategic roles?
These planning metrics incorporate the Market lens (what external talent supply looks like) and the AI/Automation lens (which roles and tasks are most susceptible to automation-driven demand shifts). Together, they transform the dashboard from a rearview mirror into a forward-looking instrument.
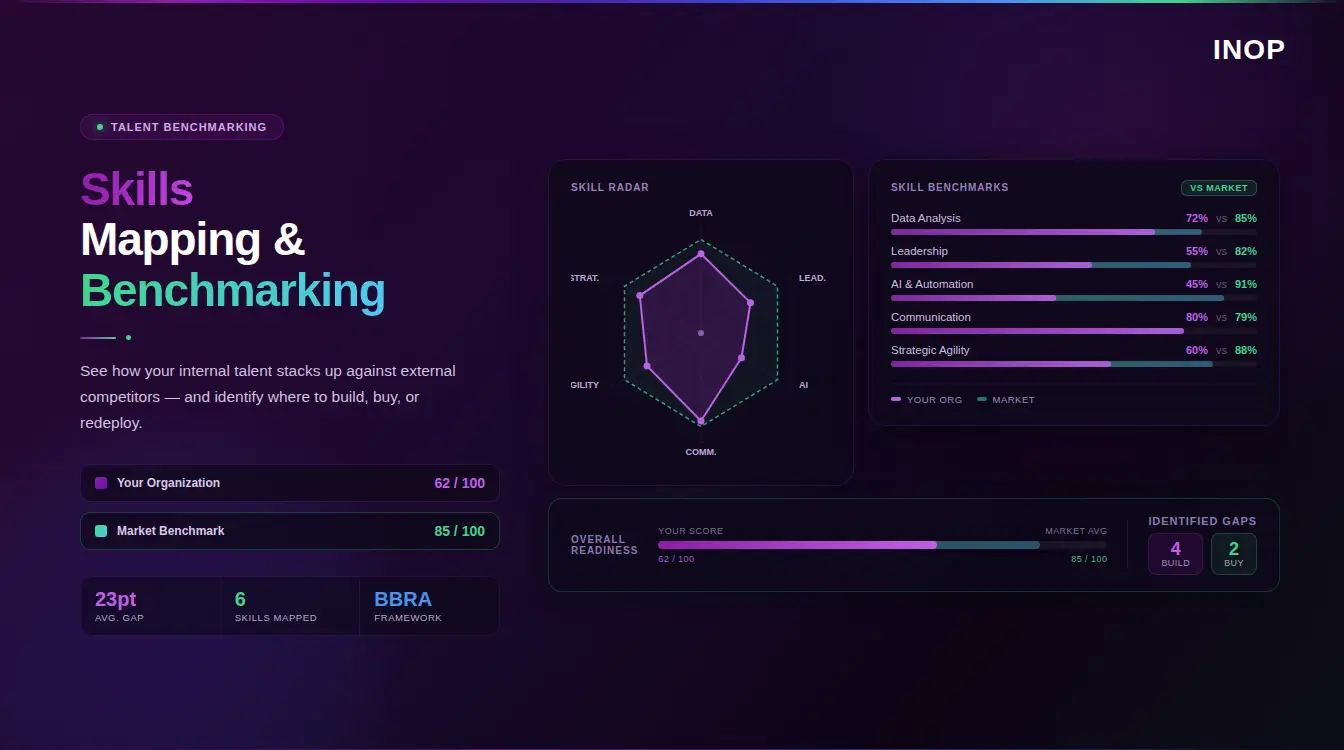
INOP’s BBRA Framework: Structuring Workforce Decisions Visually
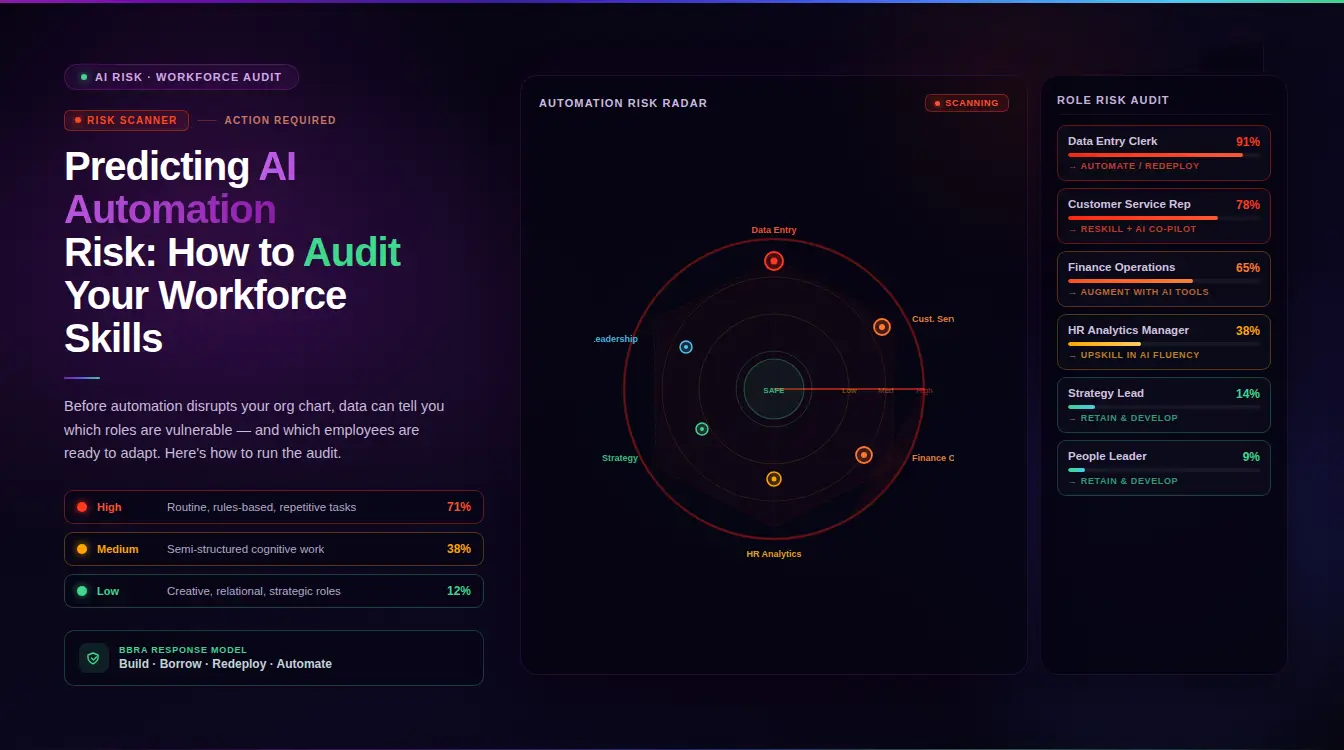
One framework that brings enormous clarity to a C-suite HR analytics dashboard is INOP’s BBRA framework: Build, Buy, Redeploy, Automate. Rather than presenting raw skills gap data, which can feel abstract, BBRA structures workforce decisions into four clear response options.
Build refers to developing capability internally through upskilling, reskilling, or structured learning programs. Buy means acquiring that capability through external hiring or acquisition. Redeploy involves moving existing talent from lower-priority areas to higher-priority ones, capitalizing on transferable skills that often go unmapped. Automate recognizes that some tasks and even roles can be partially or fully replaced by technology, freeing human capacity for higher-value work.
When a dashboard surfaces a critical skills gap, the executive question is never just “where is the gap?” It is “what do we do about it?” Displaying a BBRA decision overlay alongside each major capability gap gives the C-suite a frame for action, not just information. It also connects HR analytics to workforce investment decisions in a way that the CFO and CEO can engage with directly.
For example, if your dashboard shows a significant gap in data engineering capabilities, and the BBRA analysis indicates that 60% of that gap could be closed through targeted reskilling of existing analysts (Build), while the remaining 40% requires a senior external hire (Buy), that is a budget conversation HR can walk into with confidence.
Designing for Executive Consumption
Data quality matters. Data design matters more.
A dashboard that requires five minutes of orientation before it can be understood will not be used. C-suite leaders make dozens of decisions daily. They need HR intelligence to be fast, unambiguous, and contextual.
Lead With the Insight, Not the Data
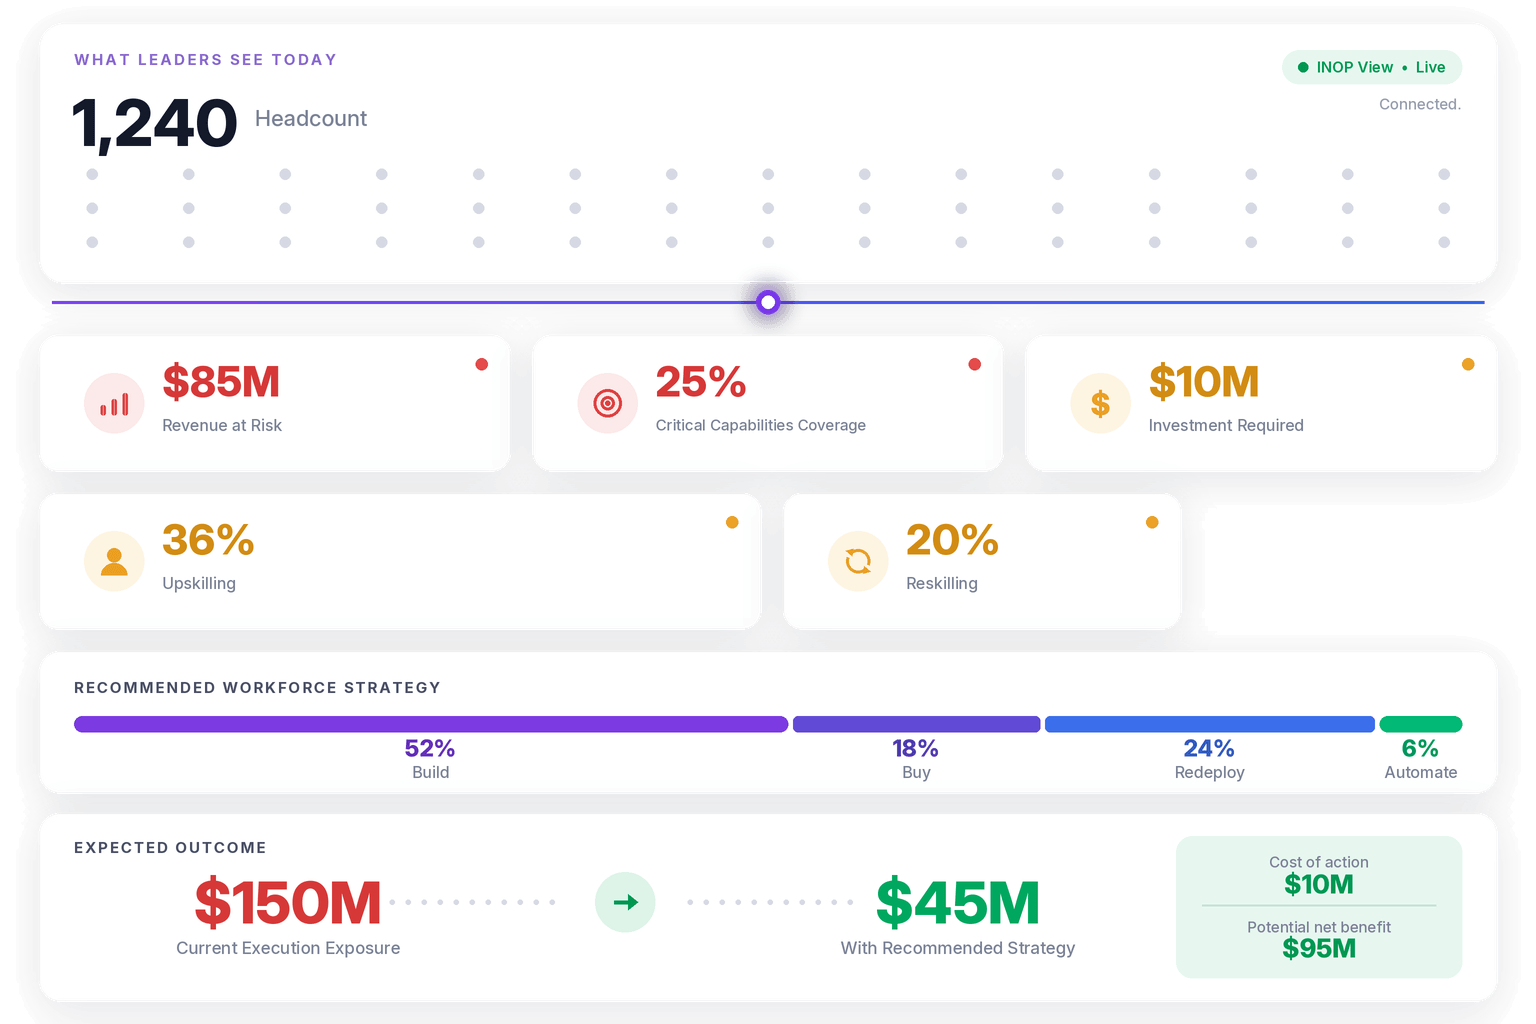
Avoid dashboards that make executives do their own interpretation. Instead of showing a 14.2% voluntary turnover rate and leaving it there, show: Voluntary turnover is 14.2%, up 2.1 points quarter-over-quarter, concentrated in mid-level engineering roles. Estimated replacement cost at current trajectory: $3.2M over 12 months.
That framing, number plus context plus financial implication, is what earns trust and drives action.
Use Benchmarks and Comparisons
A metric in isolation means little. A metric in context means everything. When your dashboard shows that time-to-fill for senior roles is 67 days, that number only becomes meaningful when compared to your historical average, your industry benchmark, or the business impact of those unfilled positions.
Benchmarks elevate HR analytics from internal scorekeeping to competitive intelligence.
Build for Mobile and Asynchronous Access
Senior leaders access information on smartphones and tablets, often between meetings, in transit, or before board calls. If your HR analytics dashboard is desktop-only, you are designing for the wrong context. Mobile-first design is no longer optional for executive-facing tools.
Limit the Number of Top-Level Metrics
The executive layer of your dashboard should surface no more than eight to ten headline metrics. These are the indicators that tell the story of workforce health at a glance. Everything else lives one click deeper, available for drill-down but not competing for attention on the primary view.
Connecting HR Analytics to Workforce Intelligence: This Is What INOP Does
A well-designed HR analytics dashboard is a front-end for something deeper: a connected intelligence layer that links people data to financial, operational, and strategic data. This is not a concept. It is what INOP delivers.
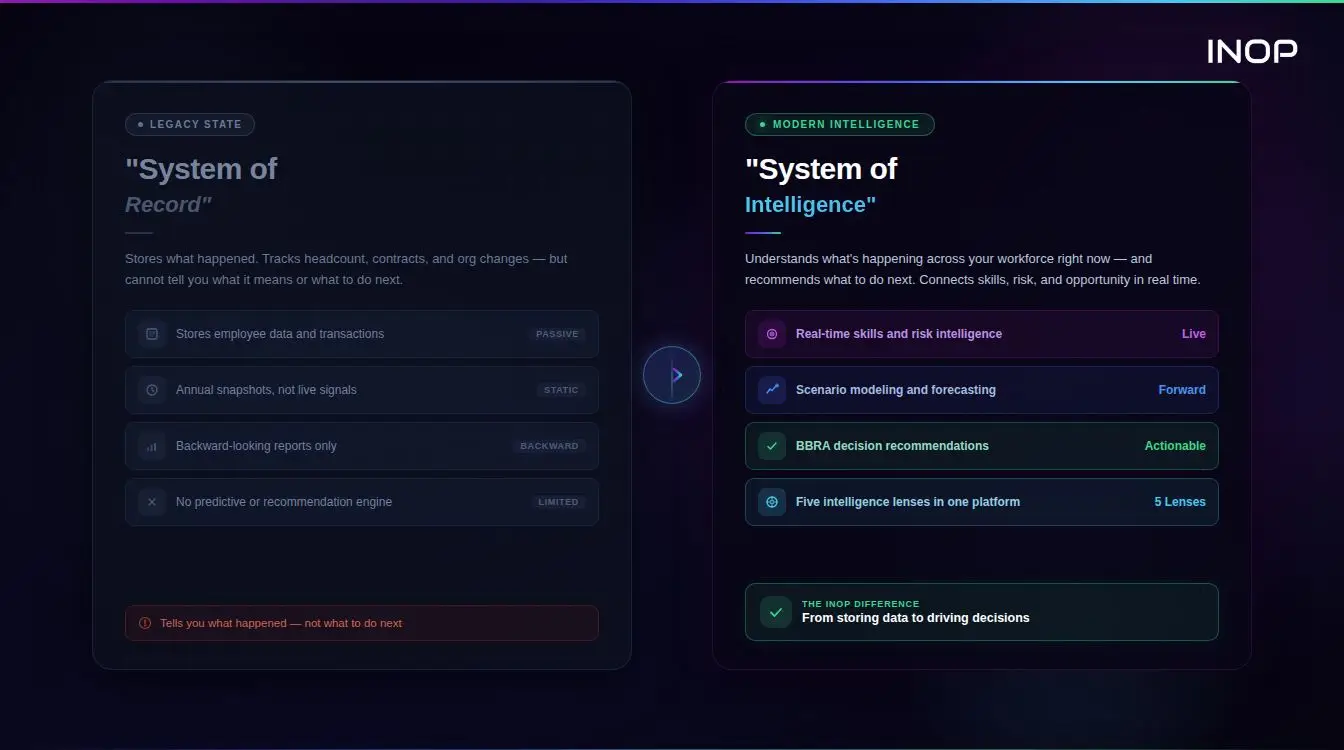
At the most basic level, HR analytics dashboards pull data from a single source, typically an HRIS, and report on what happened. At a more advanced level, they integrate data from compensation systems, performance platforms, learning management systems, and engagement tools to produce a unified workforce view.
INOP operates at the highest maturity level. The dashboard is connected to financial forecasting models, business unit performance data, and external labor market signals. It does not just show what is happening inside the organization. It tells leaders how the external talent market is shifting, what competitors are paying for critical skills, and how automation and AI are likely to affect role demand over the next two to three years. That is what it means to activate all five intelligence lenses simultaneously: Strategy, Finance, People, Market, and AI/Automation in a single decision-ready view.
The CHRO who builds a dashboard connected to this intelligence layer will be equipped to lead the AI integration conversation, not follow it. And as AI becomes further embedded in workforce processes across most organizations, that leadership position is increasingly the difference between HR having a seat at the strategy table and HR being handed decisions after they are already made.
Ready to see what a decision-ready workforce intelligence dashboard looks like in practice? Book a demo with INOP and explore how leading organizations are connecting people data to business outcomes in real time.
The Data Foundation: Getting the Inputs Right
No dashboard design saves poor data. Before investing in visualization, CHROs should audit the quality and completeness of the underlying data infrastructure.
Integrate Across Systems
Most organizations have workforce data scattered across five to ten systems: HRIS, ATS, payroll, LMS, performance management, and engagement survey tools, among others. Building a reliable C-suite dashboard requires integrating these sources into a single, normalized data layer that updates automatically.
Manual data exports and spreadsheet stitching introduce both delay and error. By the time the CHRO presents a slide deck built on last month’s HRIS export, the data is already outdated.
Establish Data Governance
Decide who owns each metric definition, who validates the data, and how discrepancies are resolved. If the finance team defines headcount differently from HR (contractors, part-time workers, secondments), your dashboard will generate conflicting numbers that undermine credibility precisely when you need it most.
Define your key metrics once, document the definitions clearly, and align them across departments before launch.
Audit for Completeness
Skills data is particularly prone to incompleteness. If only 60% of employees have validated skills profiles in your system, any skills gap analysis will misrepresent actual capability coverage. Establish minimum data completeness thresholds before surfacing certain metrics, and be transparent about confidence levels when they are shown.
A Note for PE Operating Partners
Private equity operating partners face a version of this challenge that is compressed and higher-stakes. When assessing execution risk across a portfolio company, the workforce questions are the same as those a C-suite faces, but the timeline for answering them is measured in weeks, not quarters.
INOP’s financial framing is directly applicable here. Labor cost as a percentage of revenue, regrettable turnover cost, capability concentration risk, and skills coverage against strategic priorities are exactly the metrics that reveal whether a portfolio company can execute on its value creation plan. A workforce intelligence dashboard built on INOP’s architecture gives operating partners the visibility to identify people-side risk before it surfaces as a miss on operational targets. If you are managing workforce performance across multiple portfolio companies, the dashboard infrastructure described here scales accordingly.
Building for Adoption, Not Just Delivery
The best-designed HR analytics dashboard in the world fails if no one uses it regularly. Adoption requires deliberate effort.
Start by identifying two or three C-suite champions, ideally the CFO and one business unit head, who are genuinely curious about workforce data. Work with them during the build phase to ensure the dashboard answers their actual questions. When they feel ownership over the output, they advocate for it with peers.
Run a pilot before a full rollout. Present dashboard insights in existing executive forums rather than creating a new meeting. The goal is to make the dashboard a natural part of how decisions already get made, not an additional reporting burden.
Measure dashboard adoption as a metric in its own right. Track how often each section is accessed, which metrics prompt the most follow-up questions, and where executives consistently drill down. Use that engagement data to continuously refine the experience.
Common Pitfalls to Avoid
Even experienced HR analytics teams fall into predictable traps when building for the C-suite.
Tracking too many metrics dilutes focus. If every metric is highlighted, none of them are. Prioritize ruthlessly. The C-suite layer should tell a coherent story about workforce health, not catalog every available data point.
Building for HR audiences rather than business audiences is the most common error. Ask yourself: could the CFO understand every metric on this dashboard without an HR explanation? If not, simplify the framing or replace the metric with one that travels better across functions.
Presenting data without narrative leaves executives to draw their own conclusions, often the wrong ones. Every dashboard should have a clearly articulated insight layer, either written summaries or AI-generated highlights, that surfaces the three to five most important observations the data is showing.
Finally, avoid building a dashboard that can only be maintained by one person. If the dashboard breaks every time that analyst goes on leave, it is not a strategic infrastructure asset. It is a dependency risk.
Conclusion
An HR analytics dashboard that the C-suite actually uses is not built in a tool. It is built on a clear understanding of what your executive leadership needs to decide, structured around the metrics that connect workforce reality to business outcomes, and designed for the way senior leaders actually consume information.
The core principles are straightforward: start with decisions, not data. Speak the language of cost, risk, growth, and capacity. Build on INOP’s connected intelligence layer that integrates HR data with financial and strategic context across all five lenses. Apply the BBRA framework to make workforce gaps actionable, not just visible. Design for speed, clarity, and mobile access. And invest in adoption as seriously as you invest in build quality.
The CHROs who are winning the C-suite credibility argument right now are not the ones with the most data. They are the ones who have learned to translate that data into decisions that move the business forward.
If you are ready to take that step, explore how INOP helps CHROs and executive teams connect workforce intelligence to strategy, finance, and execution in real time.
Frequently Asked Questions
What is an HR analytics dashboard?
An HR analytics dashboard is a digital tool that aggregates, visualizes, and interprets workforce data to support decision-making. Unlike static reports, a well-designed HR analytics dashboard updates in real time and translates people data into business-relevant insights around cost, risk, performance, and capability.
What metrics should a C-suite HR analytics dashboard include?
The most valuable C-suite HR metrics include revenue per employee, regrettable turnover cost, attrition risk by function, skills coverage against strategic priorities, critical role vacancy rates, labor cost as a percentage of revenue, and capability concentration risk. The key is connecting each metric to a business question, not just tracking HR activity.
Why do executives ignore most HR dashboards?
Most HR dashboards fail at the C-suite level because they report on HR operations rather than business outcomes, present data without narrative or context, update infrequently, and require HR expertise to interpret. Executives need to understand the business implication of each metric immediately, without translation.
How does INOP’s BBRA framework apply to HR analytics dashboards?
INOP’s BBRA framework (Build, Buy, Redeploy, Automate) provides a decision structure for responding to workforce gaps surfaced by analytics. When a dashboard identifies a critical skills shortage, BBRA helps structure the response options: develop the capability internally, hire it externally, move existing talent from lower-priority areas, or automate the underlying work. Embedding this framework into dashboard design turns data into action.
How long does it take to build an effective HR analytics dashboard?
A minimum viable C-suite dashboard covering five to seven headline metrics with reliable data integration can typically be built in six to twelve weeks with the right team and tooling. A fully connected workforce intelligence platform with predictive analytics and financial integration usually takes six to eighteen months to mature, depending on data infrastructure quality and organizational readiness.
What is the difference between an HR dashboard and a workforce intelligence platform?
An HR dashboard is a visualization layer that presents data collected from HR systems. A workforce intelligence platform, like INOP, goes further by integrating HR data with financial, strategic, and external market data across five intelligence lenses: Strategy, Finance, People, Market, and AI/Automation. INOP applies analytical models to surface risks and opportunities and generates recommendations that connect people decisions to business outcomes. The dashboard is the front-end; workforce intelligence is the engine underneath it.
How do you ensure C-suite adoption of an HR analytics dashboard?
Involve executives in the design process from the start. Align metrics to the specific decisions they are actively making. Present insights in existing forums rather than creating new reporting meetings. Identify two or three senior champions who can drive peer adoption. Continuously measure which parts of the dashboard are used and refine the experience based on actual engagement patterns.
How does this apply to private equity portfolio companies?
PE operating partners can use the same dashboard architecture to assess execution risk across portfolio companies. The financial framing maps directly: labor cost as a percentage of revenue, capability concentration risk, and skills coverage against value creation milestones are the metrics that reveal whether a management team can execute on its plan. INOP’s platform scales across multiple portfolio companies, giving operating partners a consistent view of workforce risk without requiring each company to build its own analytics infrastructure from scratch.
Book a Demo
Make confident workforce decisions that support strategy and value creation.