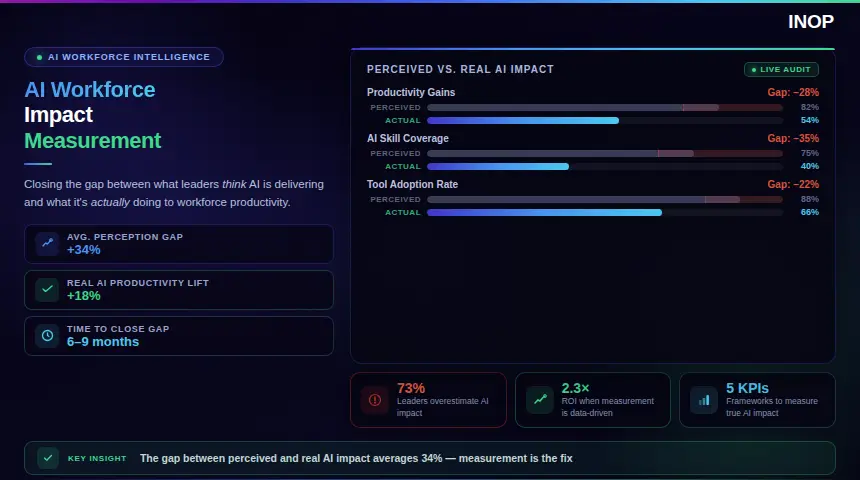
AI workforce impact measurement is the practice of tracking what AI adoption actually changes in workforce output, capability and risk, using verified data rather than confidence surveys. To measure AI impact on your workforce, set a baseline before rollout, track task-level output and quality against it, compare with a group that does not use the tool, and connect every finding to a workforce decision.
Most organizations can already tell you how their employees feel about AI. Far fewer can tell you, with evidence, what AI has changed about how those employees work. This guide covers why self-reported gains mislead, a step-by-step measurement method, the metrics that matter, a worked ROI example, and how to turn measured impact into action.
What AI Workforce Impact Measurement Means
AI workforce impact measurement answers one question: what changed because of AI, and was it the change the organization paid for? It covers four areas: output (how much work gets done), quality (how good that work is), capability (which skills people gain or lose), and risk (which roles are exposed and how people are responding).
AI Adoption Tracking vs AI Impact Measurement
Adoption tells you how many employees use a tool. Impact measurement tells you what changed as a result. Most organizations report adoption rates as though they were evidence of impact, but a tool can be used every day without changing output, quality or cost at all.
Employee Productivity Analytics vs AI Impact Measurement
Employee productivity analytics tracks activity: logins, time in applications, messages sent, meetings attended. It describes how people spend their time. AI impact measurement asks a narrower and harder question: how much of a change in output, quality or capability can be attributed to AI, compared with a baseline or a comparison group? Activity data is a useful input, but more activity is not the same as more value, and AI can raise activity while leaving results unchanged.
Why Self-Reported AI Productivity Gains Mislead
The most common way organizations measure AI impact is to ask employees. The research shows why that is not enough.
Perceived Impact Runs Far Ahead of Measured Impact
In a 2026 survey of 349 technical workers, METR found that respondents put the median value uplift from AI tools at about 1.3 times in March 2025 and 2 times in March 2026, and expected 2.5 times by March 2027. The researchers are clear that these answers are not necessarily grounded in reality: in their earlier study, developers overestimated AI’s effect on their task time by about 40 percentage points.
Studies that measure output directly find smaller and more uneven effects. A study of 5,179 customer support agents published by the National Bureau of Economic Research found that an AI assistant raised productivity, measured as issues resolved per hour, by 14 percent on average, by 34 percent for novice and lower-skilled workers, and by very little for experienced, highly skilled workers. At a wider scale, research from the Becker Friedman Institute at the University of Chicago, covering 25,000 workers in 7,000 Danish workplaces, found average time savings of about 3 percent of work hours and no significant effect on earnings or recorded hours in any of the 11 occupations studied.
Measured Value Is Concentrated in a Few Organizations
The gap shows up in business results too. The MIT NANDA report on enterprise generative AI, summarized by Virtualization Review, found that 95 percent of organizations were seeing no business return from $30 to $40 billion in enterprise spending on generative AI. The organizations that do capture value tend to share one habit: they measure impact against a baseline and act on what they find.
See how INOP measures AI’s real impact on your workforce against verified data, not sentiment. Book a demo
How to Measure AI Impact on Your Workforce: A Step-by-Step Method
A credible measurement approach follows the same sequence every time. It is built to show what changed, for whom, and what to do about it.
- Define the decision the measurement will inform.
- Set a baseline before rollout.
- Measure at task level, not company level.
- Compare with a group that does not use the tool.
- Track capability, quality and sentiment alongside output.
- Convert freed time into value, or admit it was not used.
- Repeat the measurement on a fixed schedule.
Define the Decision First
Start by naming what the result will change: whether to scale a tool, retrain a team, redesign a role or reduce spend. A measurement with no decision attached produces a report that nobody acts on.
Set a Baseline Before You Measure AI Impact
Record how long key tasks take, how many units a team completes, and how often work is reworked, before the tool is introduced. Without a baseline, every later figure is a guess. If the tool is already live, use historical system data from the months before rollout.
Measure at Task Level
AI changes tasks, not whole jobs. Pick the three to five tasks the tool is meant to affect in each role and measure those. A single company-wide productivity figure hides where AI is working and where it is not.
Use a Comparison Group
Compare teams that use the tool with similar teams that do not yet use it, or stagger the rollout so early and late groups can be compared. This separates the effect of AI from seasonality, new processes or a busy quarter.
Track Capability, Quality and Sentiment Alongside Output
Output can rise while quality falls, or while experienced people disengage. Track error and rework rates, proficiency in the skills the tool requires, and how confident employees feel using it. A role that looks more productive on paper while confidence drops is a retention risk hiding behind a good number.
Convert Freed Time Into Value
Time saved only becomes value when it is used for priority work. Track where freed hours go. If they are absorbed without a change in output, the honest result is that the tool saved time but has not yet created value.
Repeat the Measurement
Impact changes as tools mature and people adjust. Re-measure monthly in the first quarter after rollout, then quarterly, so decisions are based on current results rather than launch-day expectations.
The AI Workforce Impact Metrics That Matter
| Metric | How to calculate it | What it tells you |
|---|---|---|
| Adoption rate | Active users divided by eligible users | Context only: whether people use the tool |
| Verified time saved | Baseline task time minus current task time, from system data | Real efficiency change, not perceived change |
| Task throughput | Units completed per hour versus baseline | Whether output actually rose |
| Quality and rework rate | Errors or rework divided by units completed | Whether speed came at the cost of quality |
| Perception gap | Self-reported gain minus measured gain | How far survey results can be trusted |
| Capability uplift | Share of employees reaching proficiency in target AI skills, and time to proficiency | Whether the workforce is building lasting capability |
| Redeployed capacity | Freed hours reassigned to priority work | Whether saved time became value |
| Role exposure | Share of a role’s tasks that AI can perform or change | Where risk and redesign are concentrated |
A Worked Example: Calculating AI Impact ROI
The figures below are illustrative; replace them with your own. A finance team of 40 analysts adopts an AI assistant that costs €1,500 per seat per year, or €60,000 in total.
- Self-reported: analysts estimate they save 6 hours a week. At a loaded cost of €70 an hour over 46 working weeks, that suggests €772,800 a year.
- Measured: task timings against the baseline show 2 hours saved a week, worth €257,600 a year.
- Net verified value: €257,600 minus €60,000 gives €197,600, but only if the freed hours go to priority work.
The tool still pays back, but the verified case is about a third of the self-reported one. A budget built on the survey figure would overstate the return by more than €500,000.
Measuring Role-Level Exposure and Capability
Impact measurement also has to track which roles are structurally exposed to AI-driven change, separately from how people in those roles feel about it. The World Economic Forum’s Future of Jobs Report 2025 finds that employers expect 39 percent of workers’ existing skills to be transformed or become outdated by 2030, and half plan to move staff from declining to growing roles.
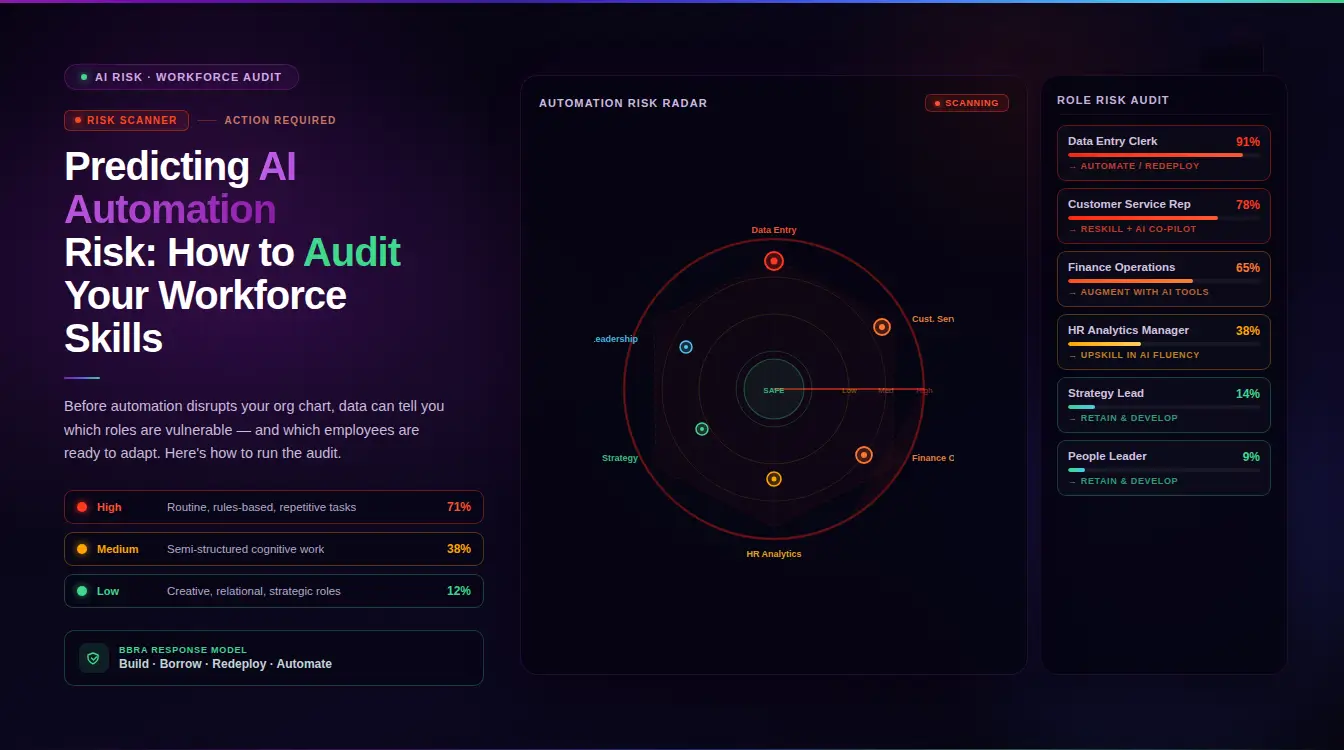
INOP’s skills intelligence maps which roles carry the highest exposure using external labor market signals rather than internal assumption, so exposure is tracked before it shows up as unplanned attrition or a rushed restructuring. For the audit method, see predicting AI automation risk, and for deciding which tasks to automate and which to augment, see AI automation vs augmentation.
Applying INOP’s Five Intelligence Lenses to AI Workforce Impact Measurement
A single productivity number, even a verified one, does not tell you whether an AI investment is working. INOP evaluates measured AI impact through five intelligence lenses before drawing a conclusion.
- Strategy: is the measured impact showing up in the business priority the AI investment was meant to support?
- Finance: does the measured gain translate into a return after tool cost, and is freed time being used?
- People: is output improving while confidence declines, a combination that predicts attrition risk?
- Market: how does measured impact compare with external benchmarks for similar roles and industries?
- AI and Automation: does the result reflect real capability uplift, or a task that was automated away, which calls for a different response?
Turning Measured Impact Into Action With BBRA
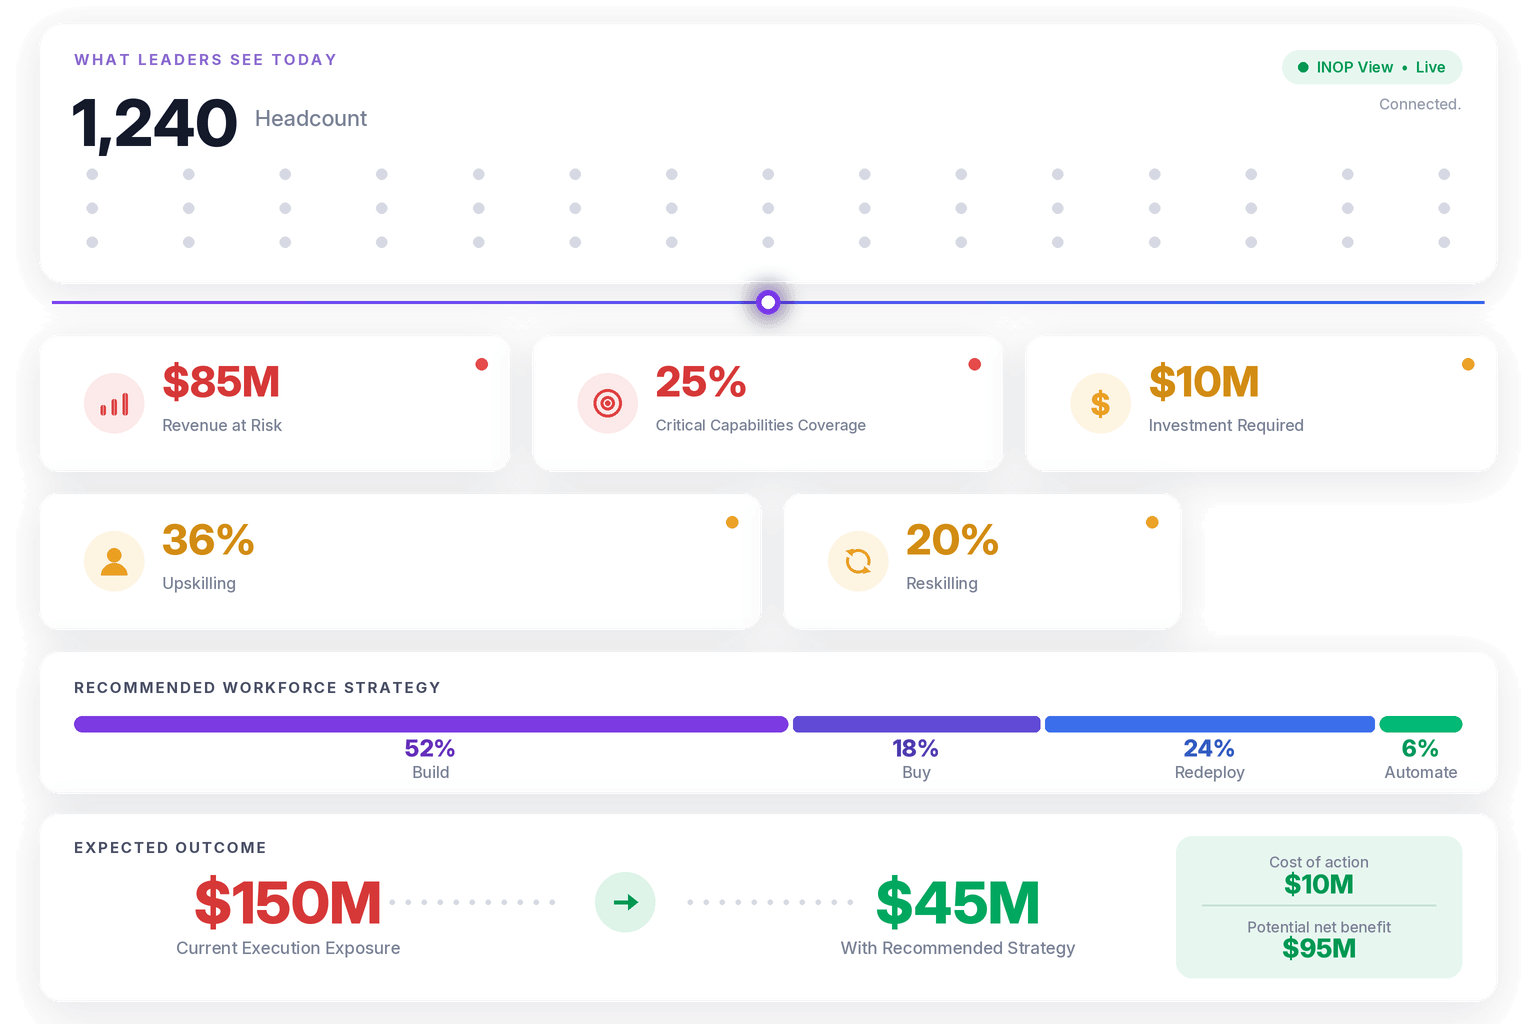
Measurement that stops at a dashboard produces awareness without a next step. INOP’s proprietary decision architecture, BBRA (Build, Buy, Redeploy, Automate), connects a measured finding to a modeled response, comparing all four pathways with their financial trade-offs across four horizons: 30 days, 180 days, one year and three years.
- Build: develop the skills the measurement shows are missing, starting with people in adjacent roles.
- Buy: bring in outside capability through contractors, partners or new roles when the skill is too scarce to build in time.
- Redeploy: move freed capacity, or people with adjacent skills, to priority work.
- Automate: extend automation where measurement shows a task is reliably handled by AI.
The NBER result shows why this matters. When novices gain 34 percent and experts gain little in the same role, the right response differs by person: experienced staff may move to higher-value work while newer staff build proficiency faster. Building on existing people is often cheaper too: INOP’s analysis of the business case for an AI skills engine estimates that identifying and reskilling an existing employee is about 23 percent more cost-effective than sourcing the capability externally.
AI Workforce Impact Measurement for Private Equity Operating Partners
Inside a portfolio company, unverified AI productivity claims are an easy place for a hundred-day plan to go wrong. A company reporting strong AI gains based on employee self-report alone is reporting exactly the kind of figure research shows runs ahead of measured results.
Standardizing AI workforce impact measurement across the portfolio through INOP’s strategic workforce planning platform gives operating partners one verified way to compare AI claims across assets. Where measurement shows that certain roles deliver outsized AI-driven value, INOP’s compensation analytics platform benchmarks their pay against the market, since people delivering verified value are often underpaid relative to what competitors would offer.
Common Mistakes in AI Workforce Impact Measurement
Treating adoption rate as impact. High usage says nothing about whether output, quality or cost changed.
Relying entirely on self-reported productivity. Self-report runs ahead of measured results, sometimes by a wide margin, which makes it a poor sole input for a budget decision.
Measuring without a baseline. Without pre-rollout data, there is nothing to compare against, and every figure becomes an estimate.
Counting saved time as value. Hours saved only matter if they go to priority work. Track where they go.
Ignoring sentiment while output looks fine. A role that appears more productive while losing confidence is a retention risk hiding behind a good metric.
Measuring once, at launch. Impact shifts as tools mature and people adjust, so measurement has to be continuous. INOP’s AI readiness assessment framework shows how to set the starting point that later measurement compares against.
Never connecting measurement to a decision. A verified impact figure that does not feed into a build, buy, redeploy or automate decision is a finding, not a plan.
Frequently Asked Questions
How do you measure AI impact on workforce productivity?
Set a baseline for key tasks before rollout, then track task time, throughput and quality against it, comparing teams that use the tool with similar teams that do not. Add capability and sentiment measures, and track whether freed time goes to priority work.
What is the difference between AI adoption tracking and AI workforce impact measurement?
Adoption tracking counts how many employees use an AI tool. AI workforce impact measurement verifies what changed in output, quality, capability and risk as a result, since usage and measurable impact often diverge.
How often should AI workforce impact be measured?
Monthly in the first quarter after a rollout, then quarterly. Impact shifts as tools mature, people adjust how they use them, and the gap between novice and expert gains changes within the same role.
What should happen after measurement identifies a gap?
Run the finding through a decision model that compares build, buy, redeploy and automate pathways before any budget or restructuring decision is made. Measurement without a decision step produces a report, not a resolved gap.
How should private equity operating partners evaluate AI impact claims?
Check whether reported gains are backed by baseline and task-level data, or rely mainly on employee self-report. Self-reported gains currently run well ahead of what independent research measures at the firm level.
Ready to see what AI is actually doing to your workforce, beyond a confidence survey? Book a demo