Most leadership teams can point to AI activity: pilots in flight, tools licensed, training under way. Fewer can say, using consistent criteria, which business units have the capabilities to scale AI, which are not yet ready, and what it would cost to close the gaps.
An AI readiness assessment framework provides that basis. It defines the dimensions you measure, the level at which you measure them, the scoring rules you apply and the logic that turns scores into decisions. Build the framework well and you can repeat the assessment across business units, portfolio companies and years, and compare the results.
CHROs, CFOs and PE operating partners need readiness findings they can defend at board level. The framework is where that starts.
What Is an AI Readiness Assessment Framework?
An AI readiness assessment framework is a repeatable method for measuring whether an organisation can deploy AI and get value from it. It defines five components: the dimensions in scope, the unit of analysis, the scoring scale and evidence rules, the weighting and thresholds, and the decision layer that converts scores into action.
| Component | Question It Settles |
|---|---|
| Dimensions | What does readiness consist of for this organisation? |
| Unit of analysis | At what level do we score: organisation, business unit, role or task? |
| Scoring scale and evidence | What does each score level mean, and what evidence supports it? |
| Weighting and thresholds | Which dimensions count most, and which gaps block progress on their own? |
| Decision layer | What happens once a gap is found, and what does each response cost? |
How Does a Framework Differ From a Single Readiness Assessment?
An AI Readiness Assessment is the exercise: an evaluation of where your organisation stands at a given point. The framework is the method behind it. Without a common framework, assessments may differ in scope and scale, making it difficult to compare this year’s results with last year’s or with those of another business unit. With one, each assessment adds to a body of evidence you can track over time.
Why Do Organisations Need a Structured Framework for AI Readiness?
Without a structured framework, readiness can be assessed differently across functions. A CTO may judge readiness by infrastructure, a CHRO by skills and a CFO by budget. A shared framework puts each view on the same scale, allowing leadership teams to debate the evidence rather than the definitions.
A Gartner survey of 197 CxOs and senior business leaders, conducted in December 2025, found that only 27% of executives have a comprehensive AI strategy, while just one in five believe their workforce is ready for AI. A framework turns that uncertainty into a measured baseline.
Which Dimensions Should the Framework Cover?
Cover three groups of dimensions: direction, foundations and workforce. Together, these dimensions assess whether an organisation has a clear strategic direction, the foundations to support AI adoption and the workforce capabilities needed to put its strategy into practice.
| Group | Dimension | What It Tests |
|---|---|---|
| Direction | Strategy | Alignment of AI initiatives with business strategy, with clear ownership and success measures |
| Direction | Leadership | AI literacy and sponsorship at each leadership layer |
| Foundations | Data | Quality, access and governance of the data each use case needs |
| Foundations | Technology | Infrastructure and integration capacity to scale |
| Foundations | Governance | AI decision-making boundaries, human oversight, monitoring and audit trails |
| Workforce | Capability | Skills and proficiency against the tasks AI will change |
| Workforce | Mobility | Capacity to move people into redesigned or adjacent roles |
| Workforce | Change readiness | Capacity to absorb new workflows and ways of working |
The direction and change dimensions earn their place. Cisco’s AI Readiness Index found that 99% of its most AI-ready Pacesetter organisations have a defined AI roadmap, compared with 58% overall, while 91% have a change-management plan, compared with 35% overall.
For the governance dimension, you can draw on criteria from an established framework. The NIST AI Risk Management Framework organises AI risk management into four functions: govern, map, measure and manage; govern is a cross-cutting function that supports the other three. Mapping your governance criteria to those functions provides an external reference point.
What Unit of Analysis Should an AI Readiness Assessment Framework Use?
Assess each dimension at the level most relevant to it, then roll the results up. For foundations such as data and technology, the organisation or business unit is often enough. For the workforce group, score at role and task level: AI changes tasks within roles, and employees with the same job title may perform different tasks and face different levels of AI exposure.
A framework that scores the workforce only at organisation level can produce an average that obscures the roles with the lowest readiness. Build the roll-up so results can be viewed at organisation, business unit, department and country level, and at individual level where that data exists.
How Should You Score and Weight AI Readiness?
Use a defined scale with evidence rules for each level, weight dimensions according to their importance to strategic objectives, and set thresholds so a strong average cannot hide a blocking gap.
| Level | Label | Evidence Required |
|---|---|---|
| 0 | Absent | No evidence the capability exists in scope |
| 1 | Emerging | Pilots or isolated pockets; no clear owner |
| 2 | Defined | Documented and owned; applied in some units |
| 3 | Operational | Applied across the scope, with evidence of use |
| 4 | Scalable | Operational and monitored; able to support additional AI initiatives with limited adaptation |
Attach a confidence level to each score. Self-reported surveys can supply a starting signal, but a score above Defined should rest on documents, system data or observed practice. Perceptions of readiness also vary by dimension: in Deloitte’s State of AI in the Enterprise research, 42% of companies said their strategy is highly prepared for AI adoption, while 30% said the same about risk and governance.
Weight the dimensions by their effect on value. BCG’s AI Radar research found that top-performing organisations follow a 10-20-70 principle, dedicating 10% of their effort to algorithms, 20% to data and technology, and 70% to people, processes and cultural transformation. While this principle concerns transformation efforts rather than assessment scoring, it highlights the importance of considering workforce and change readiness when determining how dimensions should be weighted.
How Do You Stop a Composite Score From Hiding Critical Gaps?
Set gating thresholds. For example, an initiative with governance or workforce capability below Defined may be prevented from scaling, regardless of its composite score. Report the distribution alongside the average as well: the share of roles or units at each level shows where the weak points sit, and a single composite number cannot.
How Do Readiness Scores Become Investment Decisions?
Price each gap, compare the ways to close it and sequence the responses over time. A framework that stops at a score leaves the hardest part of the work to a separate process: deciding what to fund.
For each gap, the decision layer should answer four questions:
- What does the gap cost if it stays open?
- Which responses could close it: reskilling current staff, redeploying people from adjacent roles, bringing capability in from outside or automating the work?
- What does each response cost over the short and long term?
- Which gaps pose the greatest risk to value creation and should be addressed first?
How Should You Evaluate an AI Readiness Assessment Framework?
Test any framework, whether you build it in-house, license it or develop it with an adviser, against six criteria before you adopt it.
| Criterion | Question to Ask | What Good Looks Like |
|---|---|---|
| Coverage | Does it include direction, foundations and workforce? | All three groups, each with its own evidence |
| Granularity | Can it score at role and task level? | Workforce scored where AI changes the work |
| Evidence | Is each score supported by evidence? | Supporting evidence and a confidence level for each score |
| Thresholds | Can one weak dimension stop a rollout? | Defined thresholds for critical readiness gaps |
| Financial output | Does it price gaps and responses? | Cost of inaction and pathway costs per gap |
| Repeatability | Can you rerun it across units and years? | Stable scale, definitions and roll-up |
How Does INOP Apply an AI Readiness Assessment Framework?
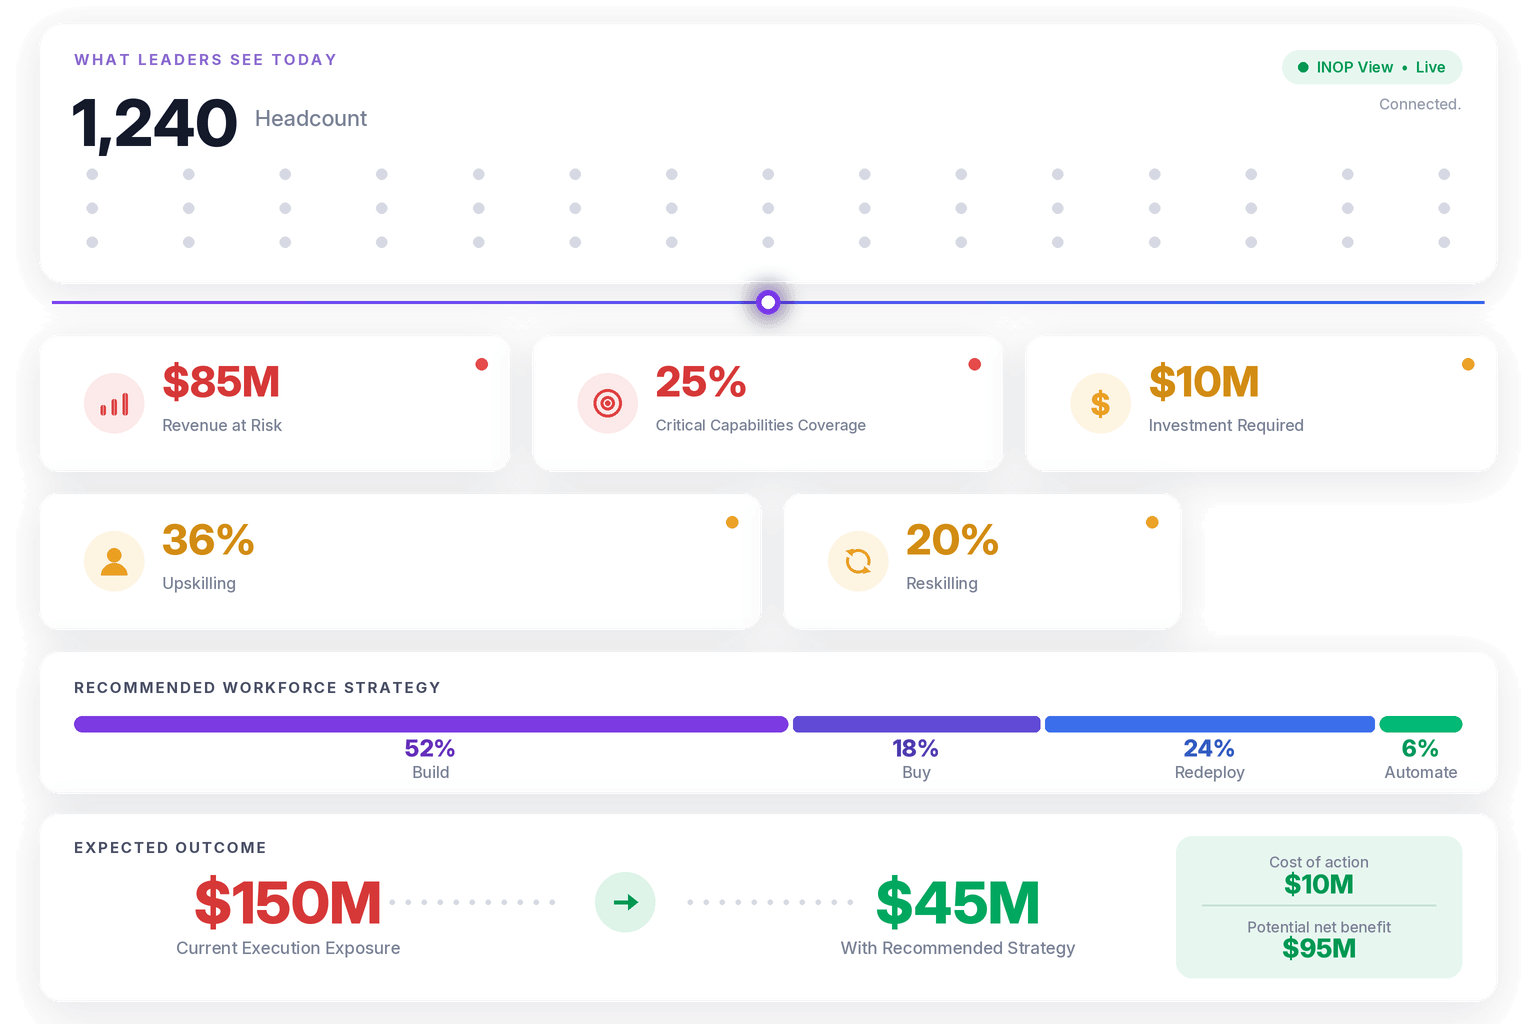
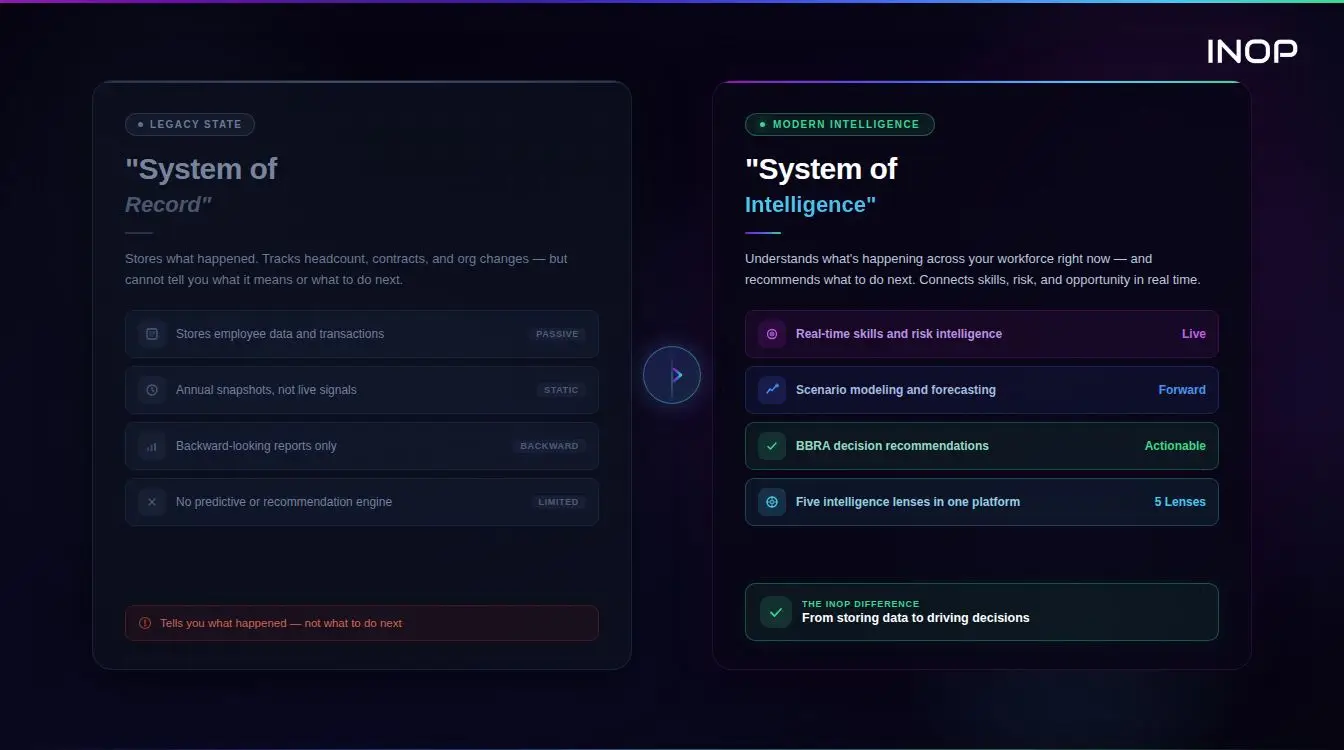
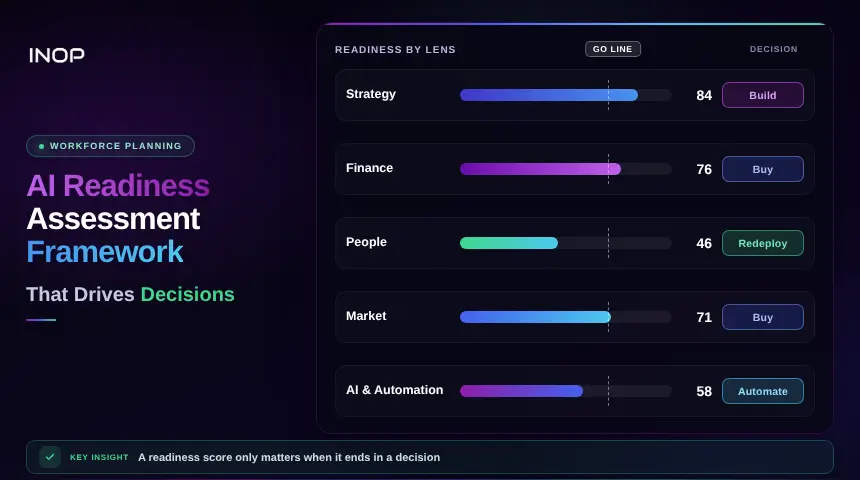
AI readiness comes down to one question: does the organisation have the capabilities to execute its strategy today and to stay ready as AI changes the work? INOP answers that question by connecting strategy, finance, people, market and AI data in one model. It shows which capabilities are in place, where the gaps and risks are, what those gaps cost if nothing changes, and the available options for addressing each gap.
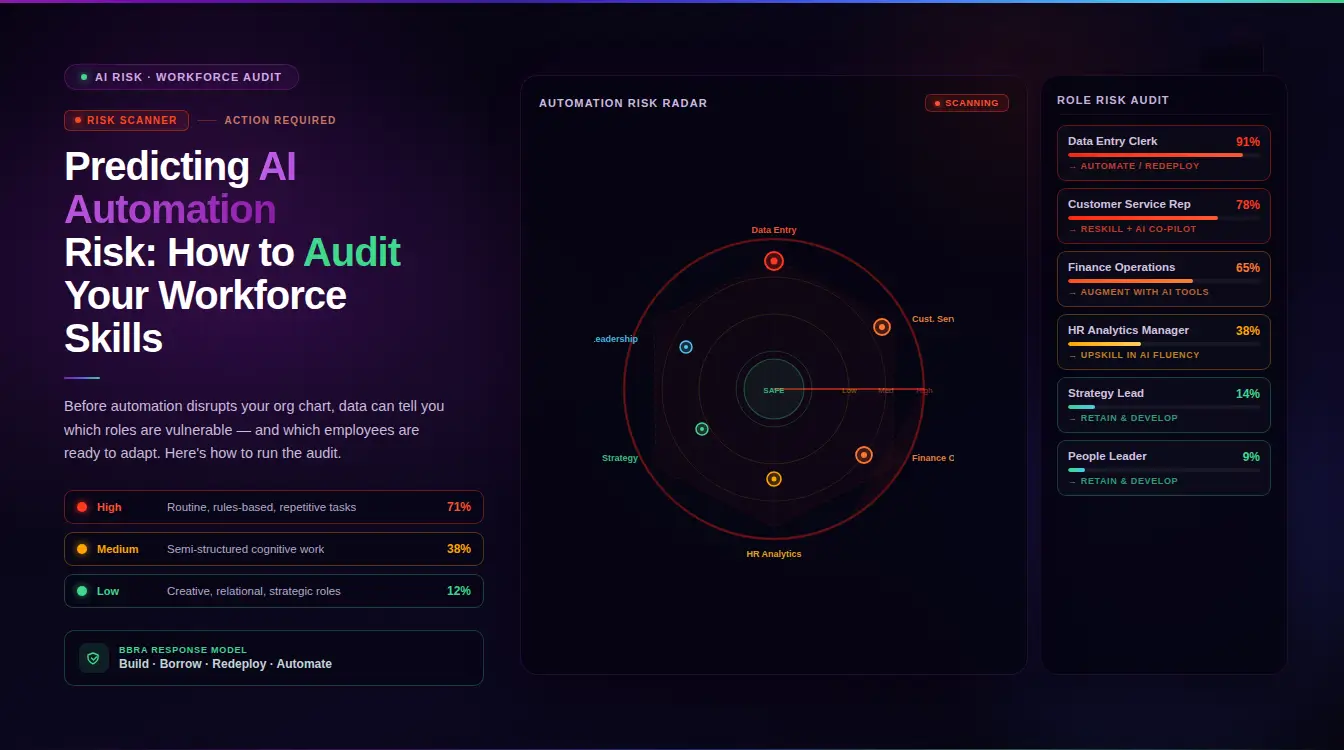
INOP never assesses AI in isolation. The significance of automating a task depends on the strategy it supports, the budget it affects, the people who perform it today and the market in which the business operates. Each INOP score therefore draws on five intelligence lenses: Strategy, Finance, People, Market, and AI and Automation. For automation, INOP classifies each task within a role as not impacted, partially augmented or fully automatable, calibrated against ten external research frameworks.
INOP covers the dimensions that influence whether a strategy can be delivered: capability, leadership, role value, mobility and culture. It complements your existing data and technology assessments rather than duplicating them. Readiness can be read at organisation, business unit, department, country and individual employee level from one consistent analysis. Where employee-level data is unavailable, INOP uses role and task-level data.
INOP’s risk model has three layers:
- Layer one: a weighted composite of five domains: Capability, Leadership, Role-Value, Mobility & Agility, and Cultural.
- Layer two: Strategic Execution Risk, derived from those five domains and your workforce plan. It estimates the probability and cost of failing to deliver the strategy. It is a derived measure, not a sixth domain, so it does not double-count.
- Layer three: Execution Materiality, which links each gap to the work it blocks and quantifies the financial exposure: delay probability, cost of delay, strategic exposure and remediation cost.
Execution Materiality is what turns a readiness finding into a decision. A capability gap can look manageable on its own. Once it is linked to the programme it could delay, leaders can weigh the cost of leaving it open against the cost of closing it.
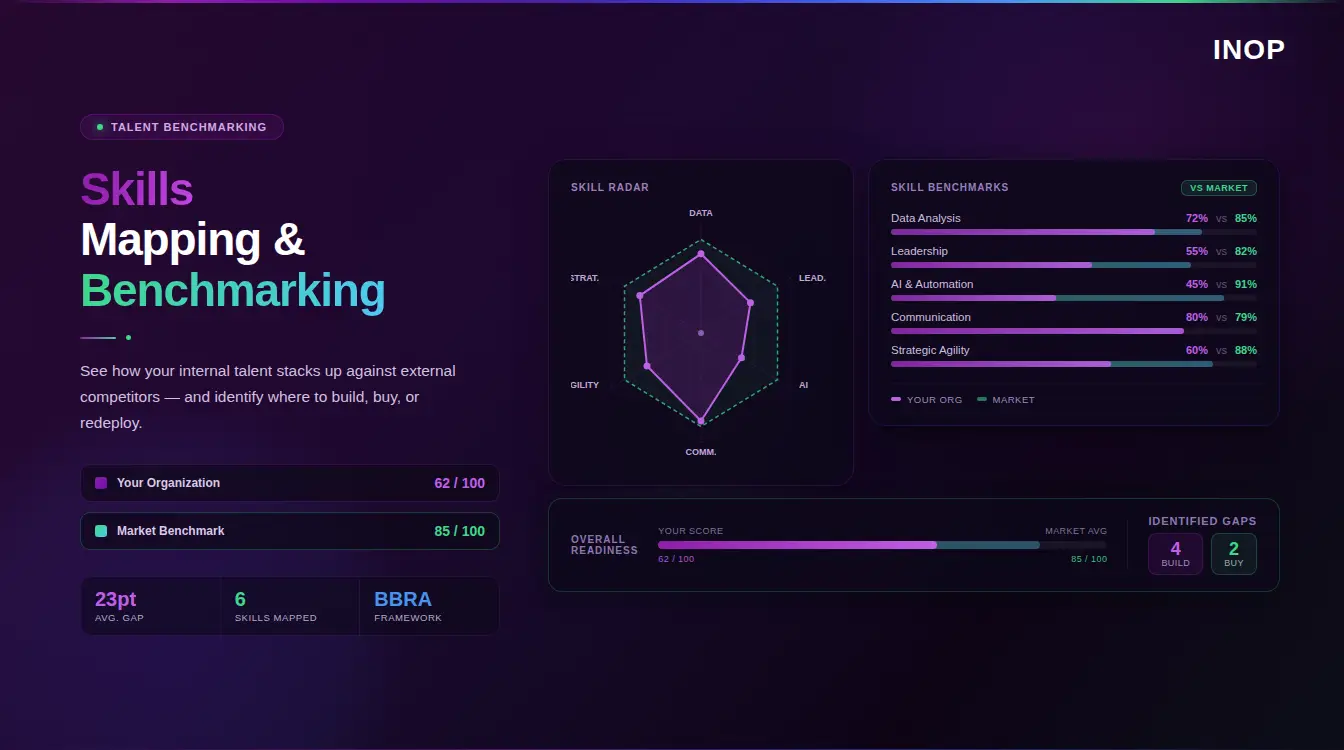
INOP’s BBRA decision architecture then turns each gap into a choice. It compares four pathways, Build, Buy, Redeploy and Automate, and prices each one across 30-day, 180-day, one-year and three-year horizons. Initial analysis is delivered within 48 hours of complete data submission. Every output carries confidence scores and source attribution, while readiness scores update as market signals, AI exposure and internal data change.
See whether your organisation has the capabilities to execute its strategy today and remain ready as AI changes the work, where the gaps lie and what closing them will cost. Book a demo.
Which Skills and Pay Data Should Feed the Framework?
The workforce dimensions need two views of skills: what your people can do today and where external demand for each skill is heading. INOP’s skills intelligence maps external demand signals to your own taxonomy, INOP’s taxonomy or a blend of both, and classifies each skill as Emerging, In Demand, Stable or Declining, alongside its AI and automation impact.
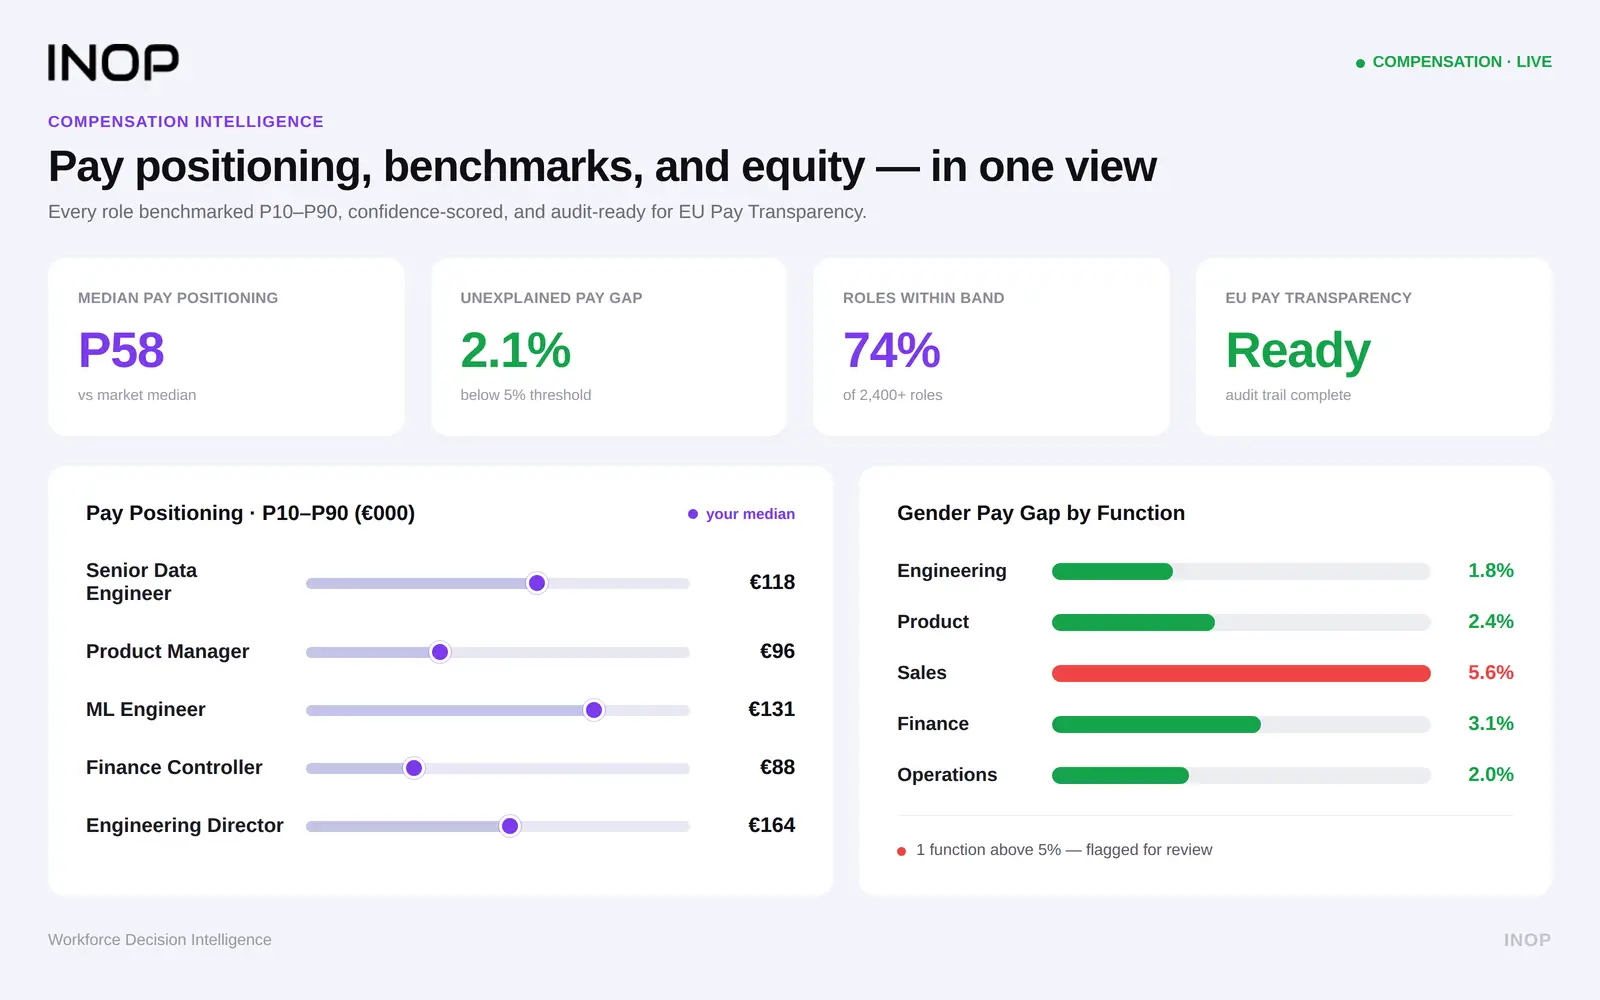
The decision layer needs current pay data to price each response. INOP’s compensation analytics platform provides real-time salary benchmarks by role, level and geography, from P25 to P90, across more than 2,400 role profiles and a taxonomy of 22,700 skills, with job posting data updated daily. These benchmarks inform the cost estimates for each BBRA pathway, so the cost of building a capability in-house can be compared with the cost of bringing it in from outside.
How Can PE Operating Partners Use One Framework Across a Portfolio?
PE operating partners get the most from an AI readiness assessment framework when they apply the same one in each portfolio company. A shared scale, unit of analysis and set of thresholds lets you compare readiness across the fund rather than relying on reports built around different definitions.
Three uses stand out:
- Diligence: test whether the AI assumptions in a value creation plan rest on capability the company has today.
- Value creation planning: sequence priorities for the first hundred days around the gaps that pose the greatest risk to value creation.
- Portfolio review: compare readiness scores and gap costs company by company, and direct support to companies that fall below critical readiness thresholds.
INOP applies the same risk layers, five intelligence lenses and BBRA horizons in each company you assess, so readiness scores, Execution Materiality and pathway costs line up across your portfolio.
See whether your portfolio companies have the capabilities to deliver their value creation plans, where execution risks lie and what addressing the gaps will cost. Book a demo.
Frequently Asked Questions
What is an AI readiness assessment framework?
An AI readiness assessment framework is a repeatable method for measuring whether an organisation can deploy AI and get value from it. It defines the dimensions in scope, the unit of analysis, the scoring scale and evidence rules, the weighting and thresholds, and the decision layer that turns scores into priced actions.
What dimensions should an AI readiness assessment framework include?
A complete framework covers three groups. Direction covers strategy and leadership. Foundations cover data, technology and governance. Workforce covers capability, mobility and change readiness. Workforce dimensions should be scored at role and task level, since AI changes tasks within roles, and employees with the same job title may perform different tasks and face different levels of AI exposure.
How do you score AI readiness?
Use a defined scale, such as Absent, Emerging, Defined, Operational and Scalable, with evidence rules for each level and a confidence rating on each score. Weight dimensions by their effect on value, and set gating thresholds so that critical weaknesses cannot be concealed by a strong composite score.
How is an AI readiness assessment framework different from the NIST AI RMF?
The NIST AI Risk Management Framework guides how organisations manage risk in AI systems through four functions: govern, map, measure and manage. An AI readiness assessment framework measures whether the organisation as a whole can deploy AI and get value from it. NIST’s functions can supply the criteria for the governance dimension.
How can PE operating partners use an AI readiness assessment framework?
PE operating partners can apply one framework across each portfolio company to test AI assumptions in value creation plans, sequence early actions around the gaps that pose the greatest risk to value creation, and compare readiness and gap costs company by company on the same scale, thresholds and time horizons.