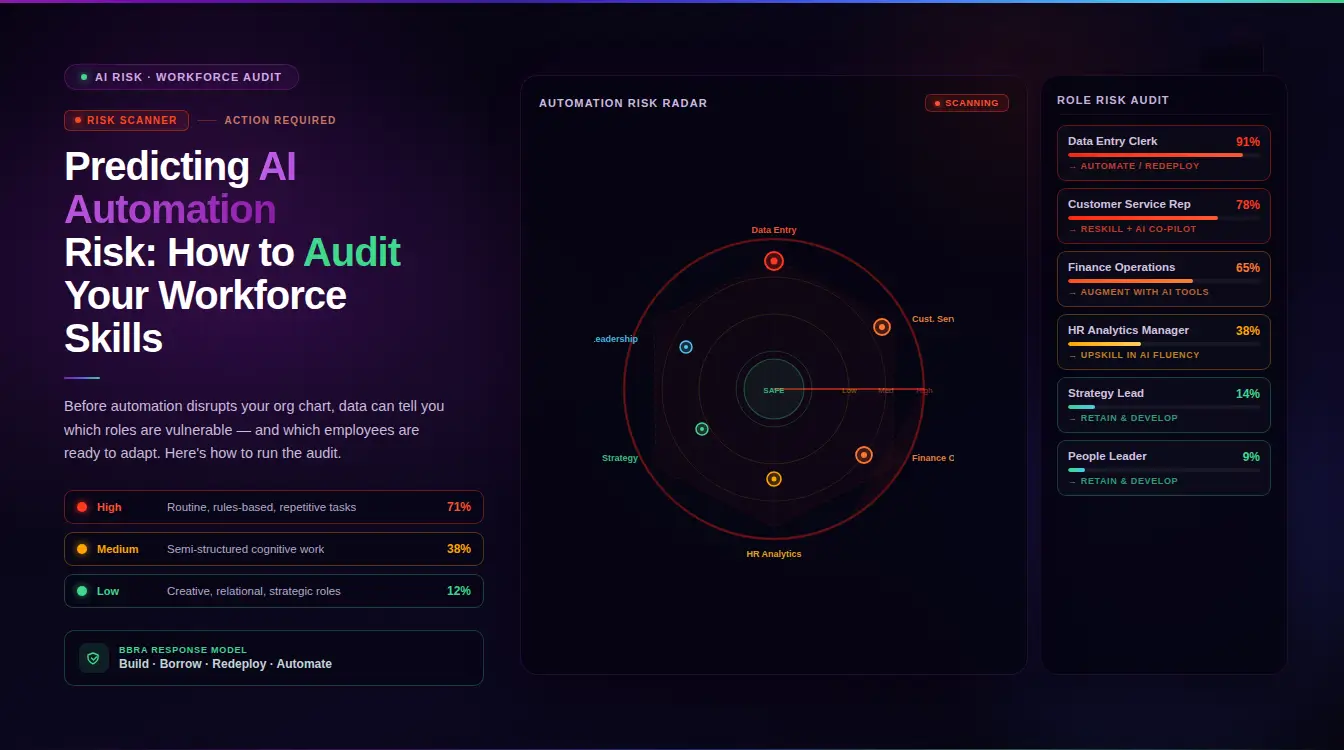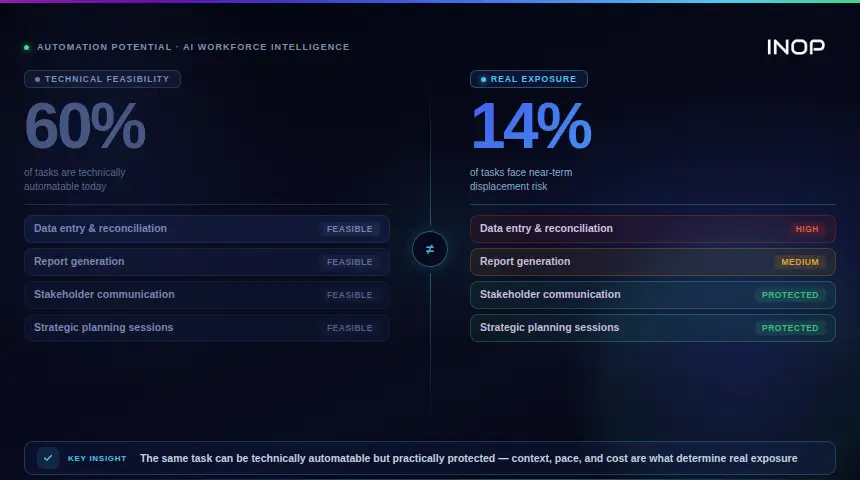
Automation potential is the share of a role’s tasks that current technology could technically automate. It measures capability, not a forecast. Real exposure also depends on economic feasibility and adoption timeline, which is why INOP assesses automation potential at the task level.
Automation potential is a measure of how much of a given work activity could, in principle, be automated using currently available technology. It is not a prediction of what will actually happen, and treating the two as the same thing is where most organizations get automation planning wrong, either overreacting to a headline number that assumes technical potential converts directly into displacement, or underreacting because a role still looks safe on the surface while a growing share of its underlying tasks quietly becomes automatable.
This guide covers what automation potential actually measures, the three-factor method that separates technical feasibility from real-world exposure, and why so many organizations misjudge automation potential in both directions at once.
What Automation Potential Actually Measures
Automation potential describes what technology could do to a work activity, given currently demonstrated capabilities, not what will actually happen to it on any particular timeline. McKinsey Global Institute’s foundational research on this topic found that fewer than 5 percent of occupations are candidates for full automation, yet almost every occupation has partial automation potential, since most jobs are a bundle of activities and only some of those activities are technically automatable. Roughly half of all the activities people are currently paid to do could potentially be automated by adapting existing technology, representing close to 15 trillion dollars in wages globally. That number describes technical potential. It says nothing on its own about when, or whether, an organization should actually act on it.
| Term | What it measures | Question it answers |
|---|---|---|
| Automation potential | What could technically be automated | What is possible? |
| Automation exposure | Potential adjusted for cost and adoption timeline | What is likely, and when? |
| Automation risk | Likelihood and impact on a role or organization | What does it mean for us? |
The Three Factors That Determine Real Automation Potential
Confusing technical potential with real exposure is the single most common error in automation planning. McKinsey’s own methodology, built since 2017 and updated repeatedly as generative AI has advanced, separates automation potential into three distinct factors that all have to align before a task actually gets automated in practice.
Technical Feasibility
This is the question most automation coverage stops at: can the technology, as it exists today, actually perform this activity. Generative AI in particular has expanded technical feasibility sharply in categories that were previously considered low potential, with the application of expertise, tasks requiring judgment, synthesis, and specialized knowledge, jumping 34 percentage points in technical automation potential in a single year of McKinsey’s tracking. Technical feasibility is necessary and nowhere close to sufficient on its own.
Assessing technical feasibility accurately also requires breaking a role down into its underlying activities rather than judging the job as a single unit. The original McKinsey methodology, still the basis for most current analysis, examined roughly 2,100 detailed work activities across about 850 occupations using the US Bureau of Labor Statistics O*NET framework, a granularity most internal automation assessments never come close to matching. An organization judging technical feasibility at the job title level, rather than the activity level, is working with a far blunter instrument than the research it is likely citing to justify its conclusions.
Economic Feasibility
Even when a solution exists in a lab or a demo, it might not make economic sense to deploy if the cost of building and maintaining it exceeds the cost of the human labor it would replace. This is why automation adoption consistently moves faster in higher-wage markets, where the cost comparison tips in favor of automation sooner, and slower in lower-wage markets where human labor remains the more economical option even when the technical capability exists.
Adoption Timeline
Even where a solution is both technically feasible and economically justified, diffusion across an economy or an industry takes time. McKinsey’s updated adoption scenarios, factoring in technology development, economic feasibility, and diffusion timelines together, now put the midpoint for automating half of today’s work activities somewhere around 2045, roughly a decade earlier than prior estimates but still a multi-decade window rather than an overnight shift.
See how INOP scores real automation potential across all three factors for your workforce. Book a demo to walk through a live exposure model.
Why Most Organizations Overestimate or Underestimate Automation Potential
Both errors are common, and both come from collapsing the three-factor model into a single number. Overestimation happens when a technically impressive demo gets treated as an economically and organizationally ready solution, without asking whether deployment costs actually beat the current cost of doing the work with people. This gap shows up starkly in current adoption data: 92 percent of companies plan to increase AI investment over the next three years, yet only 1 percent of business leaders describe their generative AI rollout as fully mature, meaning genuinely integrated into workflows and driving substantial business outcomes. Underestimation happens in the opposite direction, when a role is judged safe because its job title has not changed, while a growing share of the specific tasks inside that role quietly crosses into automatable territory without anyone tracking it at the task level.
There is also a structural reason realized value keeps lagging technical potential: the value only materializes when organizations redesign workflows around the new capability rather than automating individual tasks in isolation. McKinsey has put a number on the stakes of getting this right, estimating that AI-powered agents and robots could generate close to 2.9 trillion dollars in annual US economic value by 2030 in a midpoint adoption scenario, but only if organizations prepare their people and redesign workflows around people, agents, and technology working together, rather than bolting automation onto an unchanged process. Tracking automation potential accurately at the task level, rather than relying on periodic manual review, is where INOP’s skills intelligence platform supports this assessment directly, mapping which skills and tasks are trending toward higher automation exposure in the external market so the underestimation error described above becomes far less likely.
How Different Methodologies Estimate Automation Potential
Published estimates of automation potential differ because they measure different things. Frey and Osborne scored whole occupations, which tends to produce high headline figures. The OECD scored tasks within jobs, which produces lower ones. McKinsey estimates the share of work activities that existing technology could perform, then separates that from adoption. None is wrong. Each answers a different question. INOP draws on ten external automation frameworks rather than a single estimate, so no one method’s assumptions drive the result.
How to Run an Automation Potential Assessment
An automation potential assessment turns a headline percentage into a decision. INOP runs it in four steps, from task to timeline to action, and reports the result for the organization, business unit, department, country or individual, as well as for each role and task. The steps below show the logic.
Break Automation Potential Down to the Task Level
Start with tasks, not jobs. A role is a bundle of tasks, and each task has its own automation potential. A role described as “highly automatable” usually contains a mix of routine tasks that technology handles well and judgment-heavy tasks that it does not. List the tasks in a role, estimate the share of working time each one takes, and score each separately. This is the approach behind predicting AI automation risk across a workforce.
Illustrative example only, not INOP client data.
| Task | Technical feasibility | Economic feasibility | Adoption timeline | Decision |
|---|---|---|---|---|
| Drafting routine reports | High | High | Near term | Automate |
| Reconciling invoices from a small supplier base | High | Low (volume too small to justify the cost) | Later | Redeploy the time to higher-value work |
| Coaching a team member | Low | Not applicable | Not applicable | Build the manager’s capability |
Test Technical and Economic Feasibility Together
A task passes the technical test when current tools can perform it reliably. It passes the economic test when automating it costs less than the current way of doing the work, once implementation, maintenance, oversight and error handling are counted. Assessing only the first produces inflated numbers. Assessing both separates the tasks that are worth acting on from the tasks that are merely possible.
Set the Adoption Timeline
Feasible tasks do not all change at once. Regulation, data readiness, integration effort and wage levels in each country decide when a task actually moves. INOP models adoption across four horizons: 30 days, 180 days, one year and three years. This shows which exposure needs action now and which can be monitored.
Turn the Result Into a Build, Buy, Redeploy or Automate Decision
The assessment is only useful if it ends in a choice. For each task or role, INOP’s BBRA model compares four options: Build the capability internally, Buy it from outside, Redeploy existing people, or Automate the work. Each option is modeled across the same horizons, so leaders can see the cost, timing and capacity impact before committing.
INOP’s Five Intelligence Lenses Applied to Automation Potential
INOP draws on ten external automation frameworks rather than a single estimate, and reports exposure at role and task level, as well as for individuals, departments, business units and countries. A task scoring high on technical automation potential is not automatically a task worth automating right now. INOP evaluates every automation potential finding through five intelligence lenses before it becomes a decision.
| Lens | What It Evaluates in an Automation Potential Finding |
|---|---|
| Strategy | Whether the task sits on the critical path to business performance, since high technical potential on a low-priority task matters less than moderate potential on a critical one |
| Finance | The real economic feasibility of automating this specific task, comparing deployment and maintenance cost against current labor cost |
| People | Who currently performs the task and what happens to their remaining capacity if this specific task gets automated |
| Market | How adoption timelines and wage economics in the relevant market affect when this potential is likely to become real exposure |
| AI and Automation | The technical feasibility itself, tracked at the task level rather than assumed from the job title |
This is the same logic behind INOP’s own approach to automation exposure: the task is the unit that matters, not the job, and roughly 20 percent of tasks across a typical workforce tend to drive 80 percent of total automation exposure, which is exactly the concentration a job-title-level assessment cannot see. For a broader look at how this exposure translates into a real response once a task is confirmed as a genuine near-term candidate, INOP’s guide on workforce automation covers what should happen to the capacity a task frees up once it moves from technical potential to actual deployment.
BBRA: Turning Automation Potential Into a Modeled Decision
Once a task clears all three factors, technically feasible, economically justified, and realistically on an adoption timeline worth planning around, INOP’s proprietary BBRA framework, Build, Buy, Redeploy, and Automate, gives the resulting decision an actual financial comparison. BBRA models all four intervention pathways against tradeoffs across four time horizons: thirty days, one hundred eighty days, one year, and three years.
Applied to a confirmed automation candidate, this means the decision to automate gets compared against building internal capability around the task differently, redeploying the person currently performing it, or buying an external solution, rather than assuming automation is automatically correct simply because the technical potential score is high. A task can score high on technical automation potential and still be the wrong candidate to automate first, if its economic feasibility is weak or if redeploying the person performing it creates more value elsewhere in the organization.
Automation Potential for Private Equity Operating Partners
Inside a portfolio company, an automation potential claim used to justify a cost reduction plan deserves the same three-factor scrutiny described above. A projected saving based purely on technical feasibility, without a real economic feasibility check or an honest adoption timeline, is a common way cost-saving plans built around automation overstate what they will actually deliver in the near term. Standardizing this evaluation across a portfolio through INOP’s strategic workforce planning platform gives operating partners a consistent way to separate genuine, near-term automation potential from technically impressive but economically premature automation claims, before that claim gets built into a value creation plan.
Five Questions to Ask Before Accepting an Automation Potential Claim
Private equity operating partners often see automation potential used to justify a cost-saving plan. Before accepting the number, ask:
- Does the figure count tasks or whole jobs?
- Does it account for economic feasibility?
- Does it state an adoption timeline?
- Which source and date does the percentage come from?
- Who owns the decision once the number is produced?
A claim that cannot answer all five is a headline, not a plan.
Common Mistakes When Assessing Automation Potential
Treating technical feasibility as the whole assessment. A task being technically automatable says nothing about whether it is economically justified or realistically on a near-term adoption path. All three factors need to align before a task becomes real exposure.
Assuming a role is safe because its title has not changed. Automation potential concentrates at the task level, and a role can accumulate significant exposure through its underlying tasks well before the job title itself would suggest any risk.
Automating individual tasks without redesigning the surrounding workflow. The largest share of projected automation value depends on organizations redesigning how people, automation, and technology work together, not on automating isolated tasks inside an otherwise unchanged process.
Ignoring the bias risk in automation potential scoring itself. Leaning entirely on a vendor’s or a model’s automation recommendation without independent verification is its own risk, one covered in more depth in INOP’s guide on AI automation bias and why over-trusting an automated recommendation distorts workforce decisions.
Never revisiting the assessment as technology advances. Technical feasibility shifts quickly, generative AI alone added over 30 percentage points of automation potential to some categories of work in a single year of tracking, which means an assessment done once and left unrevisited will understate risk within a short window.
Frequently Asked Questions
How is automation potential calculated and assessed?
Automation potential is calculated at the task level. Each task is scored for technical feasibility, tested for economic feasibility, and placed on an adoption timeline. The scores are then combined by the share of working time each task takes, giving a figure for the role. INOP reports it for individuals, departments, business units, countries and the whole organization, using ten external automation frameworks.
What is the difference between automation potential and automation risk?
Automation potential measures what could technically be automated with current technology. Automation risk, or real exposure, factors in economic feasibility and adoption timeline as well, which is why a task can carry high technical automation potential while still representing low near-term risk.
How is automation potential calculated?
Established methodology breaks it into three factors: technical feasibility, whether current technology can perform the activity, economic feasibility, whether automating it costs less than the human labor it would replace, and adoption timeline, how quickly the solution is likely to actually diffuse into practice.
Why do some jobs with high automation potential still feel safe today?
Because technical feasibility is only one of three required factors. A task can be technically automatable while remaining economically unjustified or years away from realistic adoption, which is why headline automation potential figures should not be read as an immediate displacement forecast.
Does generative AI increase automation potential across all types of work equally?
No. Generative AI has expanded technical automation potential most sharply in categories involving judgment, synthesis, and expertise application, areas that were previously considered lower potential compared to routine physical or data-processing tasks.
How should private equity operating partners evaluate an automation potential claim in a cost-saving plan?
By checking whether the claim accounts for economic feasibility and realistic adoption timeline, not just technical possibility. A savings projection based on technical feasibility alone commonly overstates what a company will actually realize in the near term.
Ready to see automation potential scored across all three factors for your actual workforce? Book a demo and INOP will walk through live exposure scoring and BBRA, together.
Make confident workforce decisions that support strategy and value creation.