Executive compensation benchmarking is the process of comparing an organization’s executive pay practices against those of similar companies to determine whether packages are competitive, defensible, and aligned with performance. When boards and compensation committees get this right, they attract and retain the leadership the business needs while maintaining shareholder confidence. When they get it wrong, the consequences show up in proxy votes, leadership departures, and public scrutiny that no communications strategy fully offsets.
In June 2025, nearly 60% of Warner Bros. Discovery shareholders rejected CEO David Zaslav’s $51.9 million compensation package for 2024, a year in which the company posted an $11.5 billion loss. The board pointed to achieved performance targets and cost savings. Proxy adviser ISS recommended a “no” vote based on a disconnect between pay and performance that the benchmarking process had not surfaced clearly enough to prevent. The case illustrates the stakes. Executive compensation benchmarking is not a formality that companies complete to satisfy the compensation committee calendar. It is the analytical foundation that either supports or undermines every executive pay decision the board makes.
This guide covers what executive compensation benchmarking involves, how to select a peer group that reflects where your organization is going rather than where it is, how pay mix and positioning strategy interact, what proxy advisers look for, how ESG-linked compensation is reshaping incentive design, and where HR’s role in this process is expanding beyond data curation into strategic advisory.
Want real-time executive compensation benchmarking against verified market data? Book a 20-minute demo with INOP.
What Is Executive Compensation Benchmarking
Executive compensation benchmarking compares an organization’s executive pay packages, including base salary, annual bonuses, equity grants, long-term incentive plans, and benefits, against those of comparable organizations. The comparison answers two questions: is each component of the package positioned appropriately relative to the market, and does the total package reflect the executive’s scope of responsibility and the organization’s performance?
The process is distinct from general salary benchmarking in three ways. Executive packages involve a much higher proportion of variable and equity-based compensation, which means total compensation can diverge substantially from base salary comparisons. The peer group selection matters more because a small number of poorly chosen comparators can distort the entire analysis. And the governance dimension is more significant: executive compensation is subject to shareholder votes, regulatory disclosure, and proxy adviser scrutiny in ways that other compensation decisions are not.
The Six Components of Executive Compensation
Base salary is the fixed annual cash component. For most senior executives, base salary represents a smaller share of total compensation than at lower levels, because the design philosophy at the executive level weights variable pay more heavily to align executive reward with company outcomes.
Annual bonuses are cash payments tied to short-term performance targets, typically defined annually. The design of the target, threshold, and maximum payout levels, and the metrics they are tied to, is as important to benchmark as the payout quantum itself.
Equity grants including Restricted Stock Units and stock options create long-term alignment between executive reward and shareholder value. Benchmarking equity requires understanding not just the grant value but the vesting schedule, performance conditions, and how the total equity opportunity compares to peers over a three to five year horizon.
Long-term incentive plans are performance-based payouts over a three to five year period, typically tied to metrics like total shareholder return, earnings per share, or return on invested capital. The Conference Board’s annual executive compensation analysis of Russell 3000 companies shows LTIPs increasingly incorporating relative performance conditions rather than absolute targets, which changes how peer group selection affects payout outcomes directly.
Perquisites and benefits including executive car allowances, financial planning services, and supplemental healthcare represent a smaller share of total compensation but are frequently scrutinized in proxy statements when they appear disproportionate to peers.
Deferred compensation allows executives to defer income to future tax years. The structure of deferred compensation arrangements varies by jurisdiction and organization size and requires specific benchmarking against peers with comparable complexity.
For a foundational overview of how compensation benchmarking works at the organizational level, INOP’s guide on what is a compensation benchmark covers the methodology that executive benchmarking builds on.
The 2026 Market Context: What the Data Shows
Gallagher’s CEO and Executive Compensation Trends 2025-2026 Edition, covering 2,864 companies in the Russell 3000 and S&P 500 indexes, documents a sharp rebound in executive compensation following the volatility of 2022 and 2023. Executive compensation closely mirrors market performance, and 2024’s market recovery produced compensation increases that are now being benchmarked against peers who experienced the same tailwind.
Catapult’s 2026 National Executive Compensation Survey projects overall salary increase budgets of 3.4% to 3.6% for 2027, roughly flat with 2026 actuals. The practical implication for compensation committees is that when salary budgets are flat, bonus design and long-term incentives are where executive packages actually compete. An organization benchmarking only base salary in a year of flat budgets may conclude its package is competitive when the total compensation picture, weighted toward variable pay, tells a different story.
Most employers finalize executive compensation decisions between August and November for January effective dates. Compensation committees that start their benchmarking process in Q3 have current-year survey data available before Finance locks the budget in November. Those that start in January are making decisions against benchmarks that are already 12 to 14 months old by the time the effective date arrives.
Peer Group Selection: Start With Strategy, Not Size
Peer group selection is where executive compensation benchmarking either produces useful intelligence or misleading comparisons. Most boards default to current metrics: market cap, revenue, and industry classification. Korn Ferry’s compensation practice recommends a different starting point: benchmark against where you want to be, not where you are today.
An organization planning a global expansion should include companies that have scaled internationally in its peer group, even if those companies are currently larger. A retailer investing in digital transformation should examine technology-forward companies that have modernized their operations, regardless of industry classification. A peer group that only reflects current size and sector produces compensation packages designed to attract leaders appropriate for what the organization is today, not the leader it needs to become what the strategy requires.
The Four Peer Group Factors
Company size covers revenue, market capitalization, and employee count. Executive scope of responsibility, which drives compensation levels, correlates more with revenue complexity and operational span than with any single size metric. A company with $800 million in revenue across six business units has different CEO complexity than a company with $1.2 billion in revenue from a single product line.
Industry and business complexity determines which capabilities the executive needs and what the talent market for those capabilities actually pays. Sector-specific compensation norms vary significantly: technology companies weight equity more heavily, financial services weight short-term incentives differently due to regulatory constraints, and healthcare organizations face specific disclosure obligations around physician compensation that affect total package design.
Growth stage affects the pay mix philosophy. A high-growth company competing for a CEO against venture-backed peers will structure packages differently from a mature enterprise whose primary compensation challenge is retention rather than attraction. Benchmarking a growth company’s CEO against mature-market comparators produces a base-heavy compensation philosophy that does not reflect the talent market the company actually competes in.
Geographic scope matters when executives manage internationally distributed operations or when the talent pool for a specific role is global. A Chief Technology Officer role at a company with significant European and Asian operations benchmarks differently from the same title at a domestic-only company, because the scope drives the talent pool and the talent pool drives the market rate.
Aspirational Peers vs. Comparable Peers
A robust peer group combines two types of organizations. Comparable peers are companies of similar current size, stage, and sector against which you benchmark the range of current market practice. Aspirational peers are companies you are competing against for talent or aiming to resemble strategically, against which you benchmark the upper range of the market to understand what it costs to attract executives from those environments. Using only comparable peers sets compensation appropriate for where you are. Including aspirational peers builds packages capable of attracting the leadership profile the business strategy requires.
Pay Mix and Market Positioning Strategy
Executive compensation benchmarking is not just about whether individual components fall within market ranges. Pay mix, the proportion of total compensation coming from fixed pay versus short-term variable versus long-term equity, signals your compensation philosophy and affects which candidates your packages attract and which executive behaviors you incentivize.
Setting Market Position
Most organizations define a target market positioning as a percentile of the peer group distribution: 50th percentile as the standard, 75th percentile for talent markets where the organization needs to compete aggressively, or positioning below 50th with compensating factors like mission, culture, or growth equity. The positioning decision belongs at the board level, not the HR level, but HR should present the financial implications of each position clearly: a move from 50th to 75th percentile for a five-person executive team can represent $2 million to $8 million in additional annual compensation cost depending on company size and role level.
The Variable Pay Design Problem
Two executives at peer companies can have identical base salaries and total compensation ranges but structurally different packages: one with 30% base and 70% variable, one with 60% base and 40% variable. Benchmarking only the quantum misses the structural difference. A candidate coming from the 70% variable environment will evaluate a 40% variable offer as a step back in economic upside, regardless of the headline total compensation number.
Benchmark pay mix alongside pay level. The CowenPartners 2026 analysis of executive compensation best practices identifies pay mix analysis as one of the most commonly skipped steps in compensation reviews, and one of the most common sources of surprise when offer negotiations stall.
Say-on-Pay: What Shareholders and Proxy Advisers Expect
Public companies submit executive compensation packages to an advisory shareholder vote, known as say-on-pay, at annual general meetings. Proxy advisers ISS and Glass Lewis apply their own screening criteria to determine whether to recommend a “for” or “against” vote, and their recommendations carry significant weight with institutional shareholders who make up the majority of most public company share registers.
The Warner Bros. Discovery case demonstrates what happens when proxy adviser recommendations align with investor frustration: nearly 60% of shareholders voted against a package that the board considered justified by achieved targets. The benchmarking failure was not in the data, it was in the design. A package that produces a $51.9 million payout in a year of an $11.5 billion loss, regardless of whether specific metrics were achieved, fails the pay-for-performance reasonableness test that ISS applies.
What ISS and Glass Lewis Assess
ISS applies a quantitative screen that compares CEO pay level and pay changes against company total shareholder return relative to peers over one and three year periods. When pay and TSR diverge, ISS flags a potential misalignment and applies a qualitative review of the compensation committee’s disclosures. The qualitative review examines whether the peer group is appropriate, whether performance targets were rigorous, and whether the committee disclosed its reasoning in sufficient detail to allow shareholders to evaluate the decision.
Glass Lewis applies a similar framework with different weighting on specific factors. Both advisers have increased their scrutiny of multi-year pay outcomes rather than single-year grants, which means a compensation package that looks reasonable at grant can draw negative recommendations three years later if the realized value significantly exceeds what the grant date analysis suggested.
HR’s practical role in managing say-on-pay risk is to model the potential realized compensation outcomes under different business scenarios before the package is approved, rather than only at the grant date fair value. ISS-Corporate’s incentive benchmarking and award simulator tools, along with Monte Carlo simulation modeling, allow compensation committees to stress-test payout outcomes under a range of performance scenarios before the package design is finalized. Presenting the board with a range of potential realized values under three or four scenarios, rather than a single grant date fair value, changes the quality of the board’s compensation design decision.
ESG-Linked Executive Compensation: The Current State
ESG metrics in executive compensation have moved from a leading-edge practice to a near-standard feature in large-cap public company packages. The Conference Board’s ESG Compensation Metrics Screening Tool covers the full Russell 3000 and shows significant variation in how companies integrate ESG targets: some use standalone ESG metrics in annual bonus plans, others incorporate them as modifiers to existing financial performance calculations, and a growing number include ESG in long-term incentive plans.
The challenge for compensation committees is designing ESG metrics that are specific enough to be measurable, material enough to be meaningful, and disclosed in sufficient detail to survive proxy adviser scrutiny. A generic “culture and inclusion” target with no baseline and no defined measurement methodology produces executive compensation disclosure that ISS characterizes as lacking rigor, which creates say-on-pay risk regardless of the company’s genuine commitment to the underlying goal.
The metrics that receive the strongest proxy adviser reception are those with external verification, clear baselines, defined measurement periods, and disclosed performance targets. Greenhouse gas emission reduction with third-party verification against a named baseline year, diversity representation at defined leadership levels against a disclosed baseline, and customer or employee satisfaction against an external benchmark all meet this standard better than subjective leadership behavior assessments that cannot be independently evaluated.
For HR leaders connecting executive compensation to the broader workforce strategy, INOP’s guide on human capital risk covers how ESG workforce disclosures and human capital risk management connect to compensation governance, and INOP’s analysis of pay parity covers the internal equity dimension that proxy advisers are increasingly incorporating into compensation reviews.
Skills-Based Benchmarking: A Missing Dimension in Most Executive Reviews
Traditional executive compensation benchmarking matches titles to market ranges. A CEO role at a company of a given size and sector falls within a defined market range, and the analysis proceeds from there. This works when the capabilities that make someone an effective CEO are stable across peer companies, which they increasingly are not.
A CEO leading an AI-driven product transformation has a different capability profile from a CEO maintaining a stable enterprise business of the same revenue. The talent market for the first profile competes with technology companies offering equity-heavy packages. The market for the second profile competes with traditional enterprise executives. Benchmarking both against the same peer group and arriving at the same compensation range misses the skills premium that the transformation-capable executive commands in the current market.
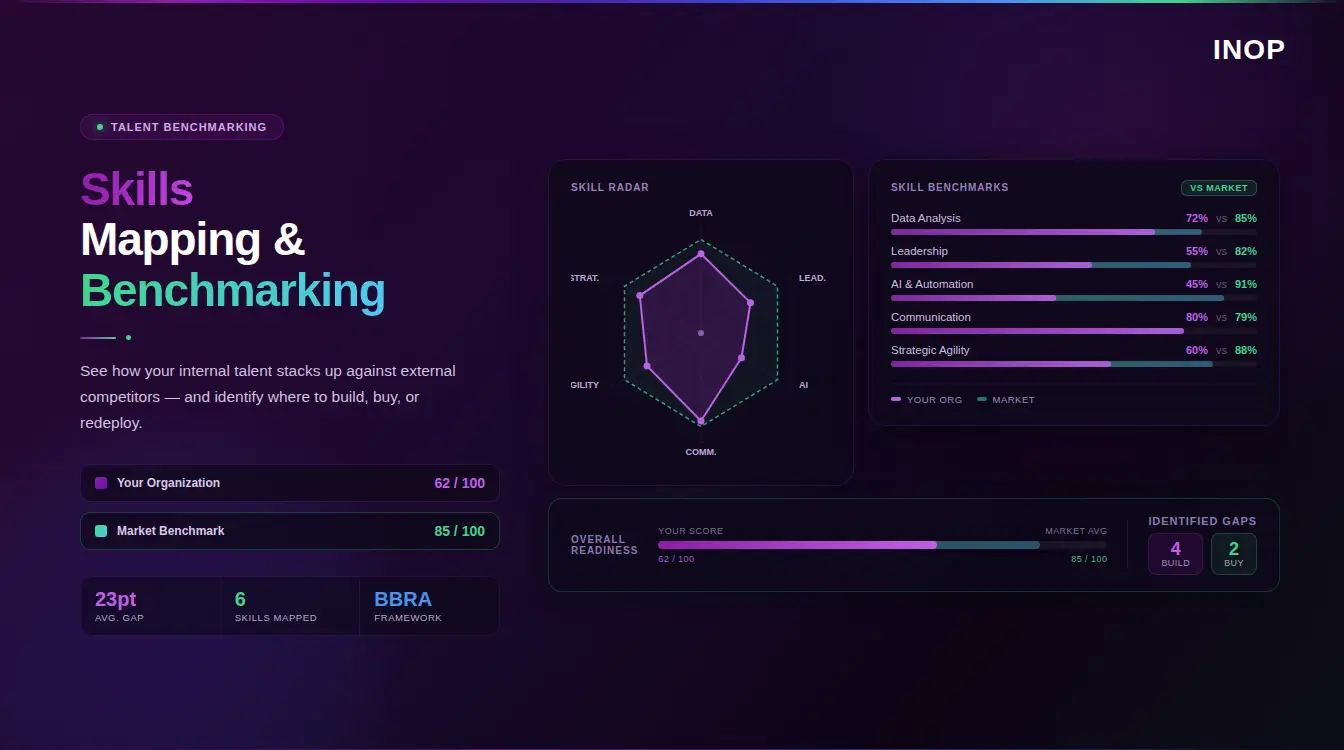
INOP’s compensation analytics platform incorporates skills-level market intelligence into compensation benchmarking at the executive level, connecting verified capability profiles to market compensation data rather than relying on title-based comparisons alone. For organizations whose executive team is navigating a significant capability shift, whether digital transformation, market expansion, or AI integration, skills-based benchmarking produces a more accurate picture of what the relevant talent market actually pays than a title-based analysis against a static peer group. For a full treatment of how skills-based pay compares to job-based pay at the broader workforce level, INOP’s guide on skills-based pay vs job-based pay covers the structural differences that apply at every level of the organization.
HR’s Role in Executive Compensation Benchmarking
Compensation committees formally approve executive pay. HR’s role has historically been to curate and present the data those committees use. In 2026, the expectation is shifting: boards want HR to bring analysis that anticipates proxy adviser concerns, models realized pay outcomes under different business scenarios, and connects compensation design to talent retention evidence rather than only to market position data.
The practical expansion of HR’s role covers five areas. Peer group validation: HR ensures the peer group reflects strategic direction and talent market reality, not just historical convention. Data interpretation: HR translates market percentile data into recommendations for total compensation positioning, pay mix design, and performance metric selection. Scenario modeling: HR presents the board with potential realized compensation outcomes under a range of business performance scenarios rather than only grant date valuations. Compliance advisory: HR monitors changes in proxy adviser guidelines, SEC disclosure requirements, and jurisdictional pay transparency obligations and brings them to the compensation committee’s attention before they create regulatory exposure. Internal equity analysis: HR assesses whether executive pay ratios relative to the broader workforce create cultural or reputational risk, particularly as CEO pay ratio disclosures become more visible to employees and candidates.
The Timing of Executive Compensation Benchmarking
Most executive compensation reviews happen on one of three schedules: annual, during major transitions, or in response to a crisis. The annual schedule produces the most predictable governance outcomes and the cleanest shareholder communication. Transition-triggered reviews happen when an executive joins, when a role scope changes substantially, or when retention risk becomes acute. Crisis-driven reviews happen after a say-on-pay failure, a significant leadership departure, or a merger that changes the executive team structure.
For organizations on a January effective date merit cycle, the right time to start the benchmarking process is August. Budget surveys publish over the summer, and starting in August means current-year benchmarks are in hand before Finance locks the budget in November. Organizations that start in January work from benchmarks that are 12 to 14 months old by the time decisions take effect, which in a volatile talent market can produce materially inaccurate market position assessments.
The compensation committee calendar should include four touchpoints annually. A Q3 benchmarking review using current survey data. A Q4 design review where package structures and performance metrics for the coming year are finalized. A Q1 disclosure review where proxy statement compensation disclosures are stress-tested against expected ISS and Glass Lewis analyses. A Q2 say-on-pay outcome review where shareholder vote results are analyzed and any remediation plan is developed before the next governance cycle begins.
Executive Compensation Benchmarking for PE-Backed and Private Companies
Private companies and PE-backed portfolio companies face executive compensation benchmarking challenges that public company frameworks do not fully address. SEC disclosure requirements and say-on-pay votes do not apply, which removes external governance pressure but also removes the structured framework that forces public company boards to be rigorous about peer group selection and performance metric design.
The talent market pressure applies regardless of ownership structure. A portfolio company CEO competing for talent against public company peers needs compensation that is competitive with those peers. A private company CFO who receives an offer from a public company with equity upside needs a retention package built on a real understanding of what that equity upside is worth, which requires benchmarking the portfolio company’s equity against public market comparables even when the company itself is private.
The PE context adds a specific dimension: executive compensation in a portfolio company needs to connect to the value creation plan rather than only to the market range. A CEO with a base salary at the 50th market percentile and an equity package tied to EBITDA milestones that reflect the value creation plan’s targets is compensated differently from a CEO with the same base salary and equity tied to generic revenue growth. The first design aligns the executive’s financial interest with the operating partner’s exit thesis. The second produces a compensation structure that pays out regardless of whether the investment returns what the model projected.
For operating partners building compensation structures across multiple portfolio companies, consistent benchmarking methodology is a governance asset. It allows comparison of executive cost and incentive structure across the portfolio on the same basis, informs integration sequencing after acquisitions where executive pay structures need to be rationalized, and produces a defensible compensation narrative for buy-side due diligence when a portfolio company is being prepared for exit.
INOP’s compensation analytics platform supports this use case, providing real-time market benchmarking connected to skills-level capability data in a format that operating partners and portfolio company boards can use directly. Book a demo to see how INOP approaches executive compensation benchmarking for PE portfolio environments.
Ready to build executive compensation packages that hold up to board review, proxy adviser scrutiny, and leadership expectations? See INOP’s compensation analytics platform in a 20-minute demo.
Common Executive Compensation Benchmarking Mistakes
Benchmarking base salary without pay mix analysis. Two packages at the same total compensation level can represent entirely different economic offers depending on the proportion of fixed versus variable pay. Candidates and incumbent executives evaluate the structural design, not just the quantum. Benchmark pay mix alongside pay level or the total compensation comparison is incomplete.
Using outdated data. Executive compensation moves with market conditions and shareholder sentiment. Gallagher’s 2025-2026 report documents a sharp rebound in compensation following prior years of restraint. A peer group analysis built on survey data from 18 months ago does not capture that rebound and produces market position assessments that are systematically below current practice.
Selecting peers based on current metrics rather than strategic direction. Peer groups built on today’s market cap and industry classification benchmark the organization against what it is, not what it is trying to become. Following Korn Ferry’s guidance to benchmark where you want to be rather than where you are today produces compensation packages capable of attracting the executive profile the strategy requires.
Ignoring proxy adviser guidelines in package design. ISS and Glass Lewis publish their proxy voting guidelines annually. Compensation committees that design packages without reference to those guidelines discover the misalignment at the annual general meeting rather than during the design process. HR should present a proxy adviser review of any proposed package design before it goes to the board for approval, not after.
Treating ESG metrics as narrative rather than measurable targets. An ESG performance target that cannot be independently verified, lacks a baseline, or covers a subjective behavioral assessment will receive negative proxy adviser attention. Design ESG metrics to the same standard as financial performance metrics: external verifiability, disclosed baseline, defined measurement period, and a stated target.
Skipping the realized pay scenario analysis. Grant date fair value is what appears in the compensation table. Realized pay, what the executive actually receives depending on company performance and stock price movement, is what shareholders and proxy advisers evaluate. Boards that approve packages based only on grant date values without modeling realized pay under different performance scenarios routinely produce compensation outcomes that surprise them when proxy advisers flag them three years later.
Frequently Asked Questions
What is executive compensation benchmarking?
Executive compensation benchmarking is the process of comparing an organization’s executive pay packages, including base salary, annual bonuses, equity, long-term incentives, and benefits, against those of comparable organizations. The goal is to determine whether each component and the total package are positioned at an appropriate level relative to the talent market the company competes in, the peer companies it benchmarks against, and the performance expectations attached to the role. For public companies, this analysis also needs to anticipate the scrutiny of proxy advisers and shareholders who evaluate the connection between pay and company performance.
How do you choose the right peer group for executive compensation benchmarking?
Start with strategic direction rather than current metrics. Companies of similar current market cap and industry classification are a baseline, but they benchmark where you are rather than where your strategy requires you to go. Add aspirational peers: companies you compete with for executive talent and companies that resemble the organization you are building toward. A useful rule of thumb from Korn Ferry’s executive compensation practice is to benchmark where you want to be, not where you are today. This produces peer groups capable of generating compensation intelligence relevant to your talent strategy rather than only your current market position.
How often should executive compensation be benchmarked?
Annual benchmarking is the standard for most organizations, supplemented by targeted reviews when an executive’s scope changes significantly, during succession planning, or when retention risk becomes acute. For organizations on a January effective date merit cycle, starting the benchmarking process in August gives you current-year survey data before Finance locks the budget in November. Compensation committees that wait until January work from benchmarks that are 12 to 14 months old by the time decisions take effect.
What do proxy advisers ISS and Glass Lewis look for in executive compensation?
Both advisers apply a pay-for-performance screen that compares CEO compensation level and pay changes against company total shareholder return relative to peers over one and three year periods. When pay and TSR diverge, they conduct a qualitative review covering peer group appropriateness, performance target rigor, and the quality of compensation committee disclosure. Packages that produce outsized realized pay in years of weak shareholder returns, as in the Warner Bros. Discovery case where nearly 60% of shareholders rejected a $51.9 million package in a year of an $11.5 billion loss, face the highest say-on-pay risk regardless of whether specific contract metrics were achieved.
What is say-on-pay and how does it affect executive compensation benchmarking?
Say-on-pay is an advisory shareholder vote on executive compensation held at public company annual general meetings. A majority “against” vote does not legally void the compensation decision but creates significant governance pressure on the compensation committee and board. ISS and Glass Lewis recommendations on say-on-pay votes carry substantial influence with institutional shareholders. Compensation benchmarking processes that model proxy adviser likely recommendations during the package design phase, rather than only after approval, reduce say-on-pay risk by addressing potential concerns before they become public governance issues.
How should ESG metrics be incorporated into executive compensation?
ESG metrics that survive proxy adviser scrutiny share four characteristics: external verifiability, a disclosed performance baseline, a defined measurement period, and a stated target with a disclosed methodology. Greenhouse gas emission reductions with third-party verification, diversity representation at defined leadership levels against a baseline, and customer or employee satisfaction against an external benchmark all meet this standard. Generic targets covering cultural leadership or inclusion values without measurable baselines do not, and proxy advisers specifically flag ESG metrics that cannot be evaluated independently as lacking rigor in compensation disclosure.
What role does HR play in executive compensation benchmarking?
HR curates and validates benchmarking data, recommends peer group composition and market positioning strategy, models realized pay outcomes under different business performance scenarios, advises on proxy adviser guidelines before package designs go to the board, ensures ESG metrics meet disclosure standards, and monitors internal pay equity between executive compensation and the broader workforce. In organizations where HR operates as a genuine strategic partner, this role extends to recommending package structures that reflect both external market benchmarks and internal capability data, particularly in organizations where executive skill profiles are changing faster than traditional title-based benchmarking captures.
Are there free sources of executive compensation data?
Yes, with limitations. SEC DEF 14A proxy filings are publicly available and contain detailed executive compensation disclosures for US public companies. Parsing this data at scale requires tools like Equilar or MyLogIQ, which are paid platforms that aggregate and structure proxy disclosure data for benchmarking purposes. The Conference Board maintains a member-only executive compensation benchmarking tool covering the Russell 3000. Free data from these sources is available but structured and synthesized data requires either significant internal analytical effort or a paid data platform. INOP’s compensation analytics platform provides real-time benchmarking connected to skills-level market intelligence rather than relying on proxy data that may be 12 to 18 months old by the time it is accessible.