Most organizations discover their workforce gaps the hard way. A product launch stalls because the engineering team is three roles short of what the project actually required. A digital transformation program misses its first milestone because the change management capability assumed to exist in the leadership layer does not. A PE portfolio company closes its first 100 days having made four hiring decisions that the original plan could have avoided if a proper workforce gap analysis had been run before close. In each case, the gap was real and closable. The cost was the time it took to find it.
A workforce gap analysis is the structured process of comparing your organization’s current workforce state, across skills, roles, headcount, capability depth, and structural alignment, against what your strategy will actually require to execute successfully. Done well, it is one of the highest-return diagnostic exercises an HR function can run. Done poorly, or not at all, it leaves leadership making people decisions on assumptions that often diverge significantly from reality.
This article covers what a workforce gap analysis involves, why it differs from a skills gap analysis, five detailed examples across different industries and contexts, a step-by-step process and template structure, the most common mistakes that invalidate the exercise, and how to connect the output to financial decisions that executives will act on.
What a Workforce Gap Analysis Actually Covers
The term is sometimes used interchangeably with skills gap analysis, but the scope is meaningfully broader. A skills gap analysis asks whether your employees have the capabilities their roles require. A workforce gap analysis asks a larger set of questions: Do you have the right number of people, in the right roles, with the right skills, structured in the right way, to execute your strategy over the next one to three years?
That broader framing matters because organizations frequently find that their most significant gaps are not skills gaps at all. They are role gaps, where the structure of the workforce does not match what the operating model requires. They are headcount gaps, where the absolute number of people in a critical function is insufficient for the plan. They are distribution gaps, where the right capability exists somewhere in the organization but is concentrated in the wrong location, function, or seniority level. And they are strategic alignment gaps, where the workforce reflects the historical business rather than the future one.
A complete workforce gap analysis covers five dimensions simultaneously: capability gaps at the skill and proficiency level; headcount gaps against the organizational model the strategy requires; role and structure gaps where the current organizational design does not support the strategy; concentration and distribution gaps where critical capabilities are unevenly held; and strategic alignment gaps where workforce investments are directed at functions that are declining in strategic importance while underserving the ones that are growing.
The business case for running this rigorously has strengthened considerably. A June 2024 Gartner survey of 190 HR leaders found that 41% agree their workforce lacks required skills, 50% agree their organization does not effectively leverage the skills it has, and 62% agree that uncertainty around future skills poses a significant organizational risk. Separately, 69% of HR professionals say their organization faces a growing skills gap challenge. These figures describe the scale of the problem. A workforce gap analysis is the mechanism that translates that awareness into a prioritized action plan.
The Five-Step Workforce Gap Analysis Process
Every effective workforce gap analysis follows this sequence regardless of industry, company size, or the specific dimensions being assessed. The steps are not interchangeable, and skipping any of them typically produces a result that is analytically incomplete.
Step One: Define the Business Objective
A workforce gap analysis with no business anchor produces a list of observations that no one acts on. Every effective analysis starts with a specific, time-bound business question. Are you preparing for a technology migration, a market expansion, an automation rollout, a succession cohort, or a post-acquisition integration? The business objective determines which roles and functions to analyze, which gaps to classify as critical versus acceptable, and which time horizon the analysis needs to address.
Without this anchor, you will produce data. With it, you will produce decisions. This step also determines the financial frame: a workforce gap analysis connected to a specific business objective can calculate the cost of the gap in terms of the business objective at risk, which is what makes the output defensible in a capital allocation conversation.
Step Two: Map Current Workforce State Across All Five Dimensions
Before you can measure a gap, you need an accurate picture of where you are. This means headcount by role, function, location, and seniority level; attrition rates broken down by the same dimensions; skills and proficiency data at the individual and role level; role structure and reporting lines against the organizational model the strategy requires; and capability distribution to identify where critical skills are concentrated versus broadly held.
Most organizations find this step harder than expected because the data is distributed across multiple systems that do not talk to each other. The HRIS holds headcount data. The LMS holds learning records. The performance platform holds assessment data. Connecting them into a unified current-state picture is itself a diagnostic: organizations that cannot produce this view quickly are revealing a data infrastructure gap that will constrain every subsequent people decision they make.
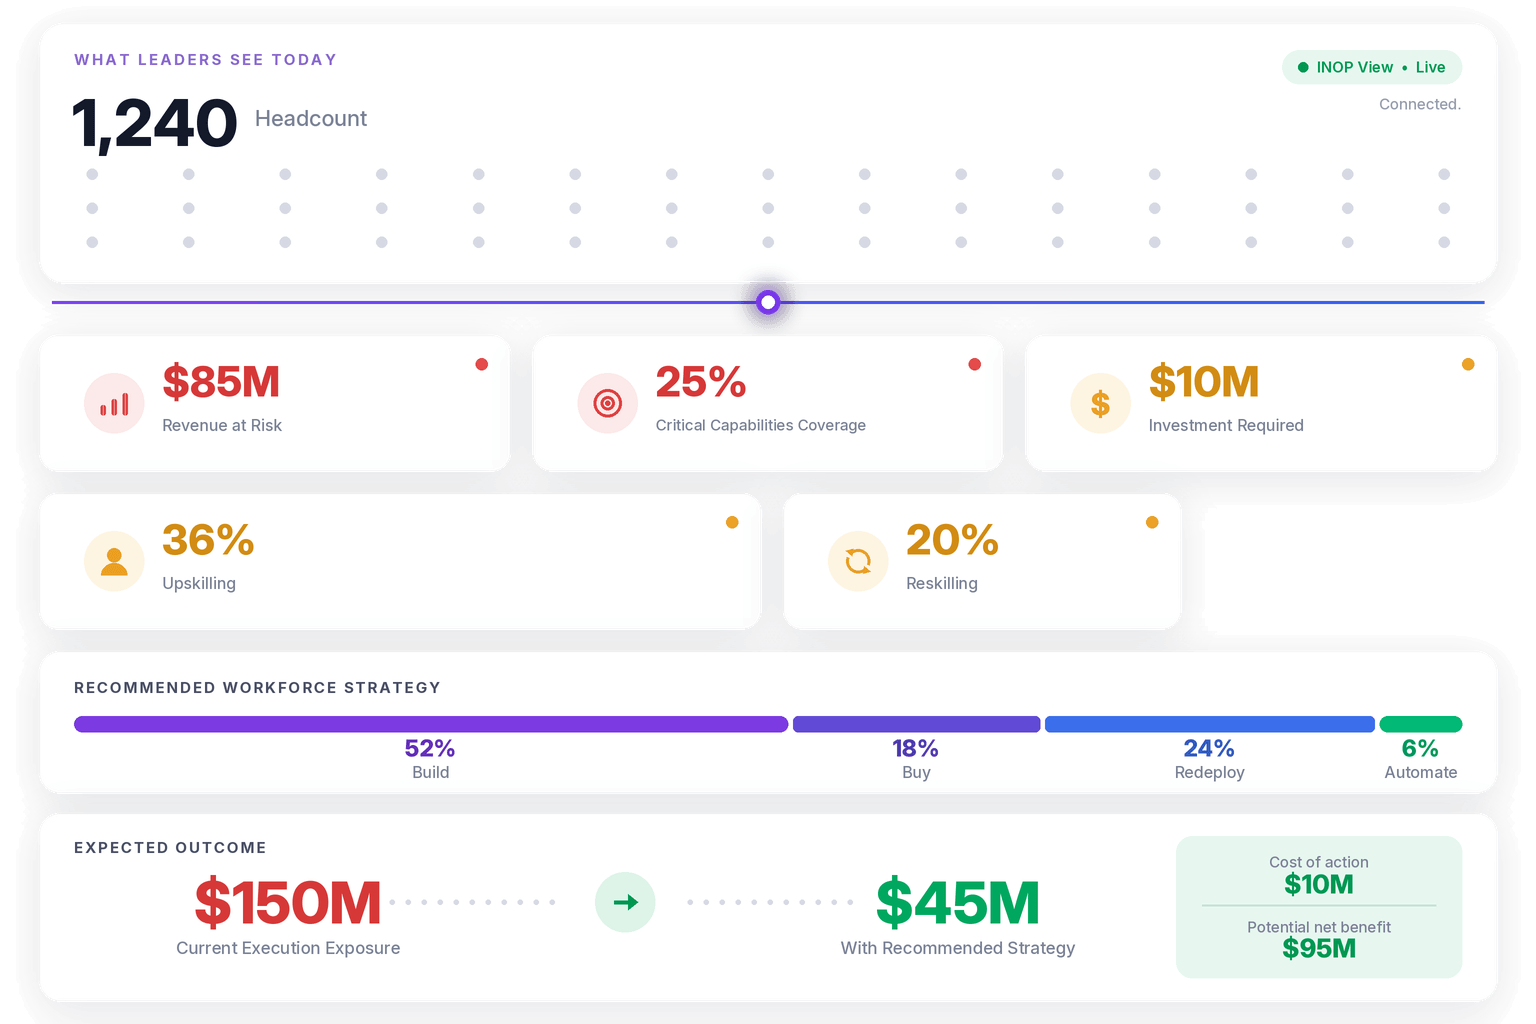
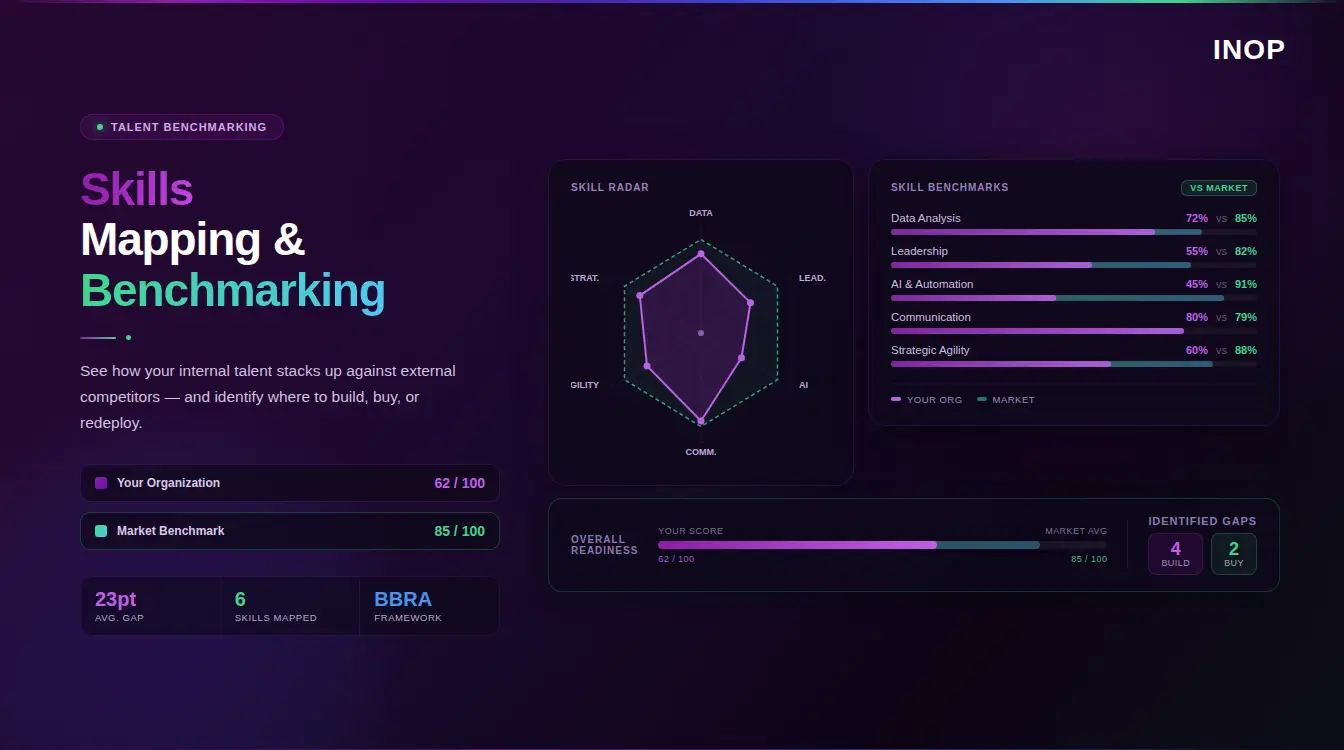
INOP’s strategic workforce planning platform is built to provide exactly this unified view, integrating across existing HR, finance, and operational data systems to produce a continuously updated picture of workforce state across all five gap dimensions. The platform’s Workforce Risk Engine scores capability risk, mobility risk, role-value risk, and strategic execution risk at the role, team, function, and business unit level, surfacing the multi-dimensional gap picture that a skills-only analysis would miss.
Step Three: Define the Future Workforce State Your Strategy Requires
The future state is derived from the business strategy, not from extrapolating the current workforce. This means translating strategic plans into specific workforce requirements: which roles need to exist that do not currently exist, which capabilities need to be at what proficiency levels, what headcount is required in which functions, and how the organizational structure needs to evolve to support the operating model the strategy assumes.
This step requires genuine collaboration between HR and the business. A future-state workforce model built by HR in isolation from the strategy team will systematically misrepresent what the business actually needs. The conversations that happen in this step, where HR asks function leaders to be specific about capability requirements rather than accepting vague headcount requests, are often the most valuable outputs of the entire exercise.
Step Four: Calculate and Prioritize the Gaps
With current state and future state defined across all five dimensions, the gap calculation is straightforward arithmetic for the headcount and structural dimensions, and proficiency scoring for the capability dimension. For each skill and role, calculate the delta between current assessed proficiency and required proficiency. For each function, calculate the headcount surplus or deficit against the future-state organizational model. For each structural element, identify where the current design diverges from the future-state requirement.
Prioritization is the step that separates actionable gap analyses from comprehensive ones. Not all gaps carry equal weight. A gap in a capability that is critical to the primary strategic initiative is a different order of problem than a gap in a support function. Weight each gap by its strategic criticality, its financial exposure, and the feasibility of the available intervention options. The prioritized gap list is what goes to senior leadership and into the investment conversation.
Step Five: Build Action Plans with Financial Models and Named Owners
Every prioritized gap needs a corresponding intervention with a financial model attached. This is where INOP’s BBRA framework, INOP’s proprietary decision architecture for workforce action, converts gap analysis into business decisions. BBRA stands for Build, Buy, Redeploy, and Automate. For each prioritized gap, INOP models all four intervention pathways with financial trade-offs across 30-day, 180-day, 1-year, and 3-year horizons, so leaders can choose the right intervention based on cost, timeline, and risk rather than defaulting to whichever feels most familiar.
Each intervention needs a named owner, a completion date, a success metric, and a quarterly review checkpoint. The most common failure in workforce gap analysis is producing a report that identifies gaps clearly and assigns no one specific accountability for closing them. Gap data without named ownership produces no change.
Workforce Gap Analysis Example: Marketing Team Digital Transformation
This is one of the most common scenarios HR teams encounter: a function built for one era of the business that needs to operate in a fundamentally different one. The gap is not just skills. It is role structure, headcount distribution, and strategic alignment with a new operating model.
The Business Objective
A mid-sized B2B organization with a 14-person marketing team recognized that traditional campaign-led marketing was underperforming. The strategic objective was a pivot to content-led demand generation with measurable attribution across the funnel. The workforce gap analysis needed to answer not just what skills were missing, but whether the current team structure and headcount could support the new model at all.
Gap Analysis Results
The capability dimension revealed critical gaps in marketing automation (team average 1.4 against a required level of 3) and web analytics and attribution (1.7 against 3). The structural dimension revealed a more significant problem: the team had no dedicated content operations function and no analytics role, meaning the capability gaps could not be closed by training alone. The headcount model for the new operating model required two roles that did not exist in the current structure.
Using a proficiency scale of one to five with behavioral anchors, the full gap picture across six priority skills was:
| Skill | Required Level | Team Average | Gap | Priority |
|---|---|---|---|---|
| Marketing automation | 3 | 1.4 | 1.6 | Critical |
| Web analytics and attribution | 3 | 1.7 | 1.3 | Critical |
| Content strategy | 3 | 2.8 | 0.2 | Low |
| SEO strategy | 3 | 2.1 | 0.9 | Medium |
| Paid social advertising | 2 | 1.2 | 0.8 | Medium |
| Data storytelling | 3 | 1.9 | 1.1 | High |
Intervention and Outcomes
The BBRA analysis produced a split intervention: Build for content strategy and data storytelling (internal workshops and certification programs), Buy for marketing automation and analytics roles (two external hires to anchor functions while internal capability developed), and an external consultant engagement for SEO and paid social given the episodic rather than daily business need.
At the 12-month mark, the team’s average capability score across the six priority skills improved from 1.85 to 3.1. Campaign attribution moved from estimated to verified, reducing wasted media spend by approximately $90,000 annually. External agency dependence reduced by 60%, saving a further $140,000 per year. The structural hires were the intervention that made the skill development investment viable rather than wasted.
Workforce Gap Analysis Example: IT Department Cloud Migration
Technology departments face a compounding version of the workforce gap problem: requirements evolve faster than training cycles, and the cost of gaps is measured in project delays and security exposure, not just performance inefficiency.
The Business Objective
A 45-person IT department at a financial services company needed to migrate 70% of legacy infrastructure to cloud within 24 months while maintaining SOC 2 compliance throughout. The workforce gap analysis needed to address capability gaps, structural gaps in the team’s architecture function, and a concentration risk dimension that a skills-only analysis would have missed entirely.
Key Findings
The assessment combined Pluralsight Skills IQ assessments for cloud and DevOps competencies, technical walkthroughs for architecture design capability, and peer review of recent code contributions. The results surprised leadership in two directions. The team was stronger on security theory than expected, with 78% scoring at intermediate or above on SOC 2 conceptual knowledge. The implementation gap was severe: only 12% had applied those frameworks in a modern cloud environment. Cloud architecture capability was concentrated in three individuals, creating a key-person risk where the migration plan depended on people whose departure would derail the entire programme. Container orchestration was effectively absent, with 89% of the team at foundational or below on Kubernetes and Docker.
The concentration risk dimension was the most significant finding. A skills gap analysis would have identified the capability gap. The workforce gap analysis surfaced the structural fragility: the team was one resignation away from a programme-stopping risk.
Intervention and Outcomes
The organization addressed both the capability gap and the concentration risk simultaneously. Five high-potential engineers received intensive AWS Solutions Architect certification with 20% of their time protected for structured learning over six months. Two senior cloud architects were hired externally to lead migration workstreams and mentor the internal team. After 18 months, cloud architecture capability was distributed across nine team members rather than three. The migration was running ahead of schedule at 65% completion versus a 60% target, and the concentration risk had been eliminated as a programme threat.
Why a Skill Gap Analysis with AI Requires a Different Approach
The IT department cloud migration example illustrates a pattern now appearing across virtually every function in 2026: capability requirements shifting faster than development cycles can follow. In most skill categories, a six to twelve month development programme is sufficient to close a meaningful proficiency gap. When the gap is specifically in AI-related capabilities, that assumption breaks down.
AI skills decay faster, compress faster, and diverge from self-reported proficiency more severely than almost any other capability category. An employee who completed a machine learning certification eighteen months ago may be operating with a framework already superseded by more capable tooling. A data team reporting high AI fluency in an engagement survey is frequently describing comfort with consumer AI tools, not verified ability to deploy, govern, and audit AI outputs inside a regulated workflow. These distinctions matter enormously for a workforce gap analysis because they change both the measurement approach and the intervention design.
Running a skill gap analysis with AI as the primary subject requires three specific adjustments to the standard process described above. First, the skills taxonomy must be treated as a moving target: the capabilities relevant to assess today may not be the right ones in six months, which means building a quarterly refresh cadence into the assessment design rather than treating it as an annual exercise. Second, self-assessment must be weighted more lightly than in other capability domains, because the gap between perceived and verified AI proficiency is consistently wider than in most other areas. Objective task-based verification, using real workflow scenarios rather than multiple-choice knowledge tests, is the only reliable evidence source for AI capability at the proficiency levels that strategic decisions require. Third, the gap picture needs to be segmented by urgency horizon: some functions face immediate AI capability gaps constraining current operations, while others face emerging gaps that will only become critical over a two to three year window. Treating both with the same intervention speed wastes investment in one direction and creates execution risk in the other.
The BBRA framework applies directly once the AI-specific gap picture is clear. Build where internal reskilling is feasible within the required timeline. Buy where the capability is needed faster than development can deliver. Redeploy where employees in adjacent roles have the foundational capability to accelerate into AI-specific competency with targeted support. Automate where the gap itself can be partially offset by deploying AI tools that lower the human capability threshold the role requires, buying time for the development programme to produce results.
Workforce Gap Analysis Example: Clinical Healthcare Assessment
Healthcare organizations face workforce gap challenges with an additional compliance layer: many capability requirements are set by external licensing bodies rather than internal role definitions, which both simplifies and constrains the analysis.
The Business Objective
A regional hospital network with 340 nursing staff needed to assess readiness for an expanded cardiac care unit, a new oncology programme, and a digital patient records transition, all launching within 18 months. The workforce gap analysis needed to identify who was ready now, who could be developed within the required window, and where external recruitment was the only viable path.
Gap Analysis Results by Programme
| Programme | Key Skill Required | Staff Ready Now | Developable in Six Months | Requires External Hire |
|---|---|---|---|---|
| Cardiac Care Unit | ACLS and cardiac monitoring | 41 nurses (12%) | 89 nurses (26%) | 18 FTEs |
| Oncology Programme | ONS certification and chemo admin | 17 nurses (5%) | 34 nurses (10%) | 22 FTEs |
| EHR Transition | Epic proficiency and data documentation | 62 nurses (18%) | 219 nurses (64%) | 0 FTEs |
The oncology programme presented the most significant workforce gap: specialty certification timelines are externally set and cannot be compressed, meaning external recruitment needed to begin immediately rather than after internal development was attempted. The workforce gap analysis changed the recruitment timeline by eight months, a direct consequence of having the multi-dimensional picture rather than just a skills assessment.
Workforce Gap Analysis Example: Leadership Capability Assessment
Leadership gaps are often the most consequential and the least rigorously assessed. The cost of a promoted-too-early manager does not appear in a productivity metric. It shows up in team attrition, engagement deterioration, and missed delivery targets in ways that take 12 months to fully surface.
The Business Objective
A 280-person technology company found that voluntary attrition in teams led by first-time managers was 38% higher than in teams led by experienced managers. The workforce gap analysis needed to determine whether this was a selection gap, a development gap, or a structural gap in role expectations.
Assessment and Findings
A 360-degree assessment across six leadership competencies, with direct report scores carrying 50% of the total weight, produced a clear finding. First-time managers scored strongly on strategic communication and inclusive decision-making, indicating the selection criteria had some validity. The critical gaps were concentrated in developmental coaching (average 1.9 out of 5, compared to 3.4 for experienced managers) and performance accountability (average 1.7, compared to 3.1). These two gaps directly corresponded to the behaviors most predictive of team attrition.
The workforce gap analysis conclusion was precise: this was a development gap, not a selection gap. The right people were being promoted. They were not receiving the structural support to develop the two highest-impact leadership capabilities. That distinction changed the entire intervention design.
Intervention and Outcomes
A six-month leadership accelerator built around coaching and performance accountability, using real organizational scenarios rather than generic case studies, was launched for first-time managers. At 12 months, voluntary attrition in those teams had decreased by 31%. Engagement scores increased by 18 points on average. The retention improvement alone, valued at the organization’s average replacement cost of 1.2 times annual salary per departed employee, generated an estimated return of 420% on the programme investment.
Want to see a workforce gap analysis built for your specific organizational context?
Book a demo with INOP and explore how our Decision Intelligence Layer surfaces multi-dimensional workforce gaps across capability, headcount, structure, and strategic alignment.
Workforce Gap Analysis Example: PE Portfolio Company Capability Audit
Post-acquisition workforce gap analysis operates on a compressed timeline with higher financial stakes than a standard HR exercise. The operating partner needs to know, within 90 days, whether the workforce can execute the value creation plan, where capability and structural risk is concentrated, and what the cost of closing gaps looks like in investment terms.
The Situation
An industrial services company acquired by a PE firm had 380 employees and a three-year value creation plan requiring significant growth in digital service delivery, predictive maintenance capability, and client analytics. The workforce had strong operational depth in traditional service delivery but had never been systematically assessed against the emerging capability requirements the new strategy demanded.
The Assessment Protocol
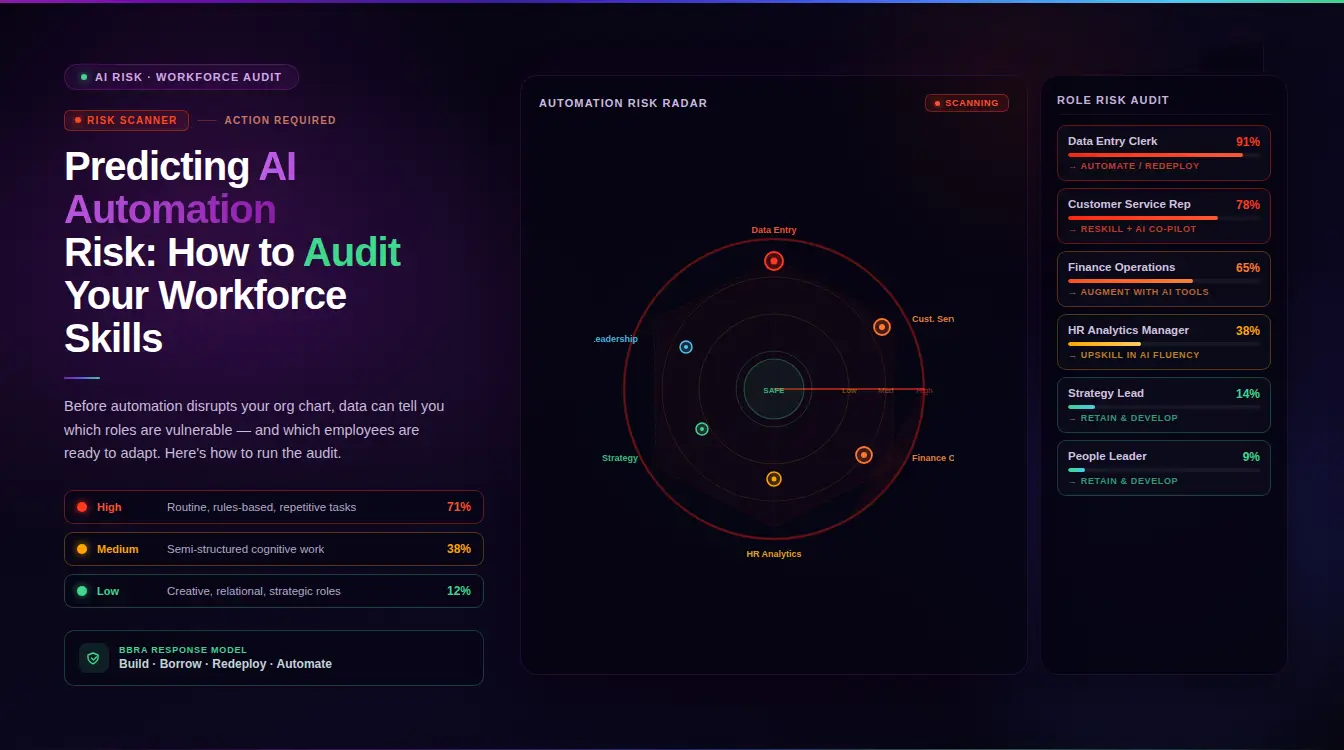
Working with INOP’s strategic workforce planning platform, the operating partner ran a structured workforce gap analysis across all roles above a defined salary threshold within the first 60 days of ownership. The analysis covered capability against both existing and emerging role requirements; management and leadership depth against the organizational structure required by the growth plan; and digital and data literacy across the workforce as a foundational input to the digital service delivery objective. INOP’s AI and Automation intelligence, applied across 40,000+ roles using seven published research frameworks, modelled automation exposure for each role family across near-term, medium, structural, and transformational time horizons.
Key Findings
Three findings shaped the first 12 months of the operating plan. Predictive maintenance capability, central to the value creation thesis, was held by four individuals in one geographic location. This was not closable by training within the required timeframe: external hiring was the only viable path and needed to start in month two rather than month twelve. The management layer immediately below the CEO had strong operational competence but a critical gap in commercial and client relationship capability, directly constraining the revenue growth targets. Digital literacy was higher than expected: 40% of field technicians scored at foundational or above on IoT data reading and basic analytics, significantly expanding the reskilling addressable population for the digital service programme.
Financial Value of the Analysis
The 90-day workforce gap analysis changed four capital allocation decisions. The hiring plan was reprioritized toward predictive maintenance specialists rather than the original commercial hire sequence. Two commercial leadership roles were added to the management layer. The digital reskilling programme was expanded from a pilot of 30 to a rollout of 140. A planned external training investment was redirected to an in-house apprenticeship model after the analysis identified internal instructors within the existing workforce.
INOP’s platform connected the workforce gap baseline directly to financial scenario modelling, allowing the operating partner to present the board with a skills-adjusted version of the value creation plan within 90 days of close. The BBRA framework modelled all four intervention pathways across 30-day, 180-day, 1-year, and 3-year financial horizons, giving the board investment-grade rigour on every workforce decision in the plan.
Workforce Gap Analysis Template: Structure You Can Use Immediately
The following template structure works across all five examples above. It is designed to be implemented in a spreadsheet for teams under 50 employees, and in a dedicated workforce intelligence platform for larger organizations where manual aggregation becomes a bottleneck.
Individual Assessment Matrix
| Skill or Capability | Required Level (1-5) | Self-Assessment | Manager Assessment | Verified Score | Gap | Intervention |
|---|---|---|---|---|---|---|
| [Skill name] | [e.g. 3] | [1-5] | [1-5] | [avg or test result] | [Required minus Verified] | [Build / Buy / Redeploy / Automate] |
Populate this for every employee in scope. Then aggregate by skill column to see team-level averages and total gap magnitude for each capability. Add separate sheets for headcount gaps (current versus required FTE by role and function) and structural gaps (current org design versus future-state model).
Action Plan Template
| Gap | BBRA Intervention | Owner | Target Date | Success Metric | Review Date |
|---|---|---|---|---|---|
| [Gap name] | [Build / Buy / Redeploy / Automate with specific programme] | [Named person] | [Date] | [Measurable outcome] | [Quarterly checkpoint] |
Connecting Workforce Gap Analysis to Skills Intelligence and Compensation Data
A workforce gap analysis that informs only internal L&D decisions is using a fraction of its potential value. When gap data is connected to external market intelligence, it answers the questions that the internal analysis alone cannot: is the capability you need available in the market, at what cost, on what timeline, and is external demand for that capability rising or falling?
INOP’s Skills Intelligence service maps external demand signals directly to your internal skills taxonomy at the proficiency, role, and sector level, with four signal states, Emerging, In Demand, Stable, and Declining, contextualized to the specific labor markets your organization competes in. This external layer changes the workforce gap analysis in two important ways. It tells you whether a gap is growing or shrinking in the external market as AI and automation reshape role requirements. And it tells you whether the intervention you are planning, particularly the Buy pathway, is feasible at the cost and timeline you have assumed.
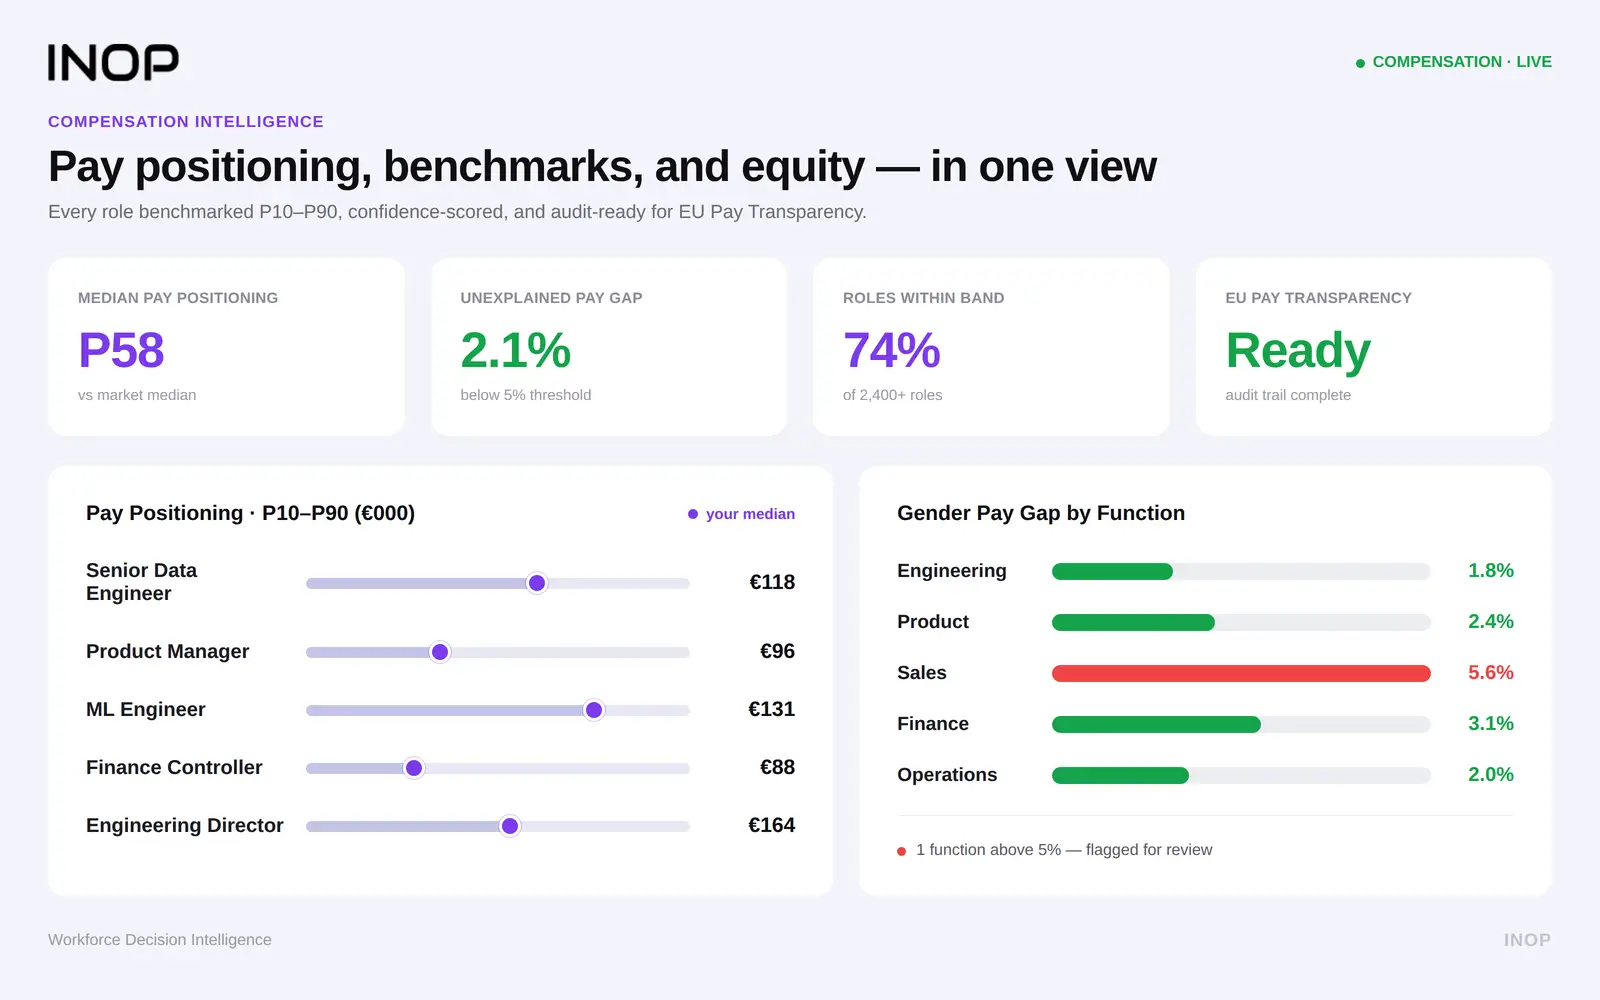
INOP’s compensation analytics platform adds the pricing dimension, drawing on 3.5 million global job postings across 16 countries and a 22,700-skill taxonomy to provide real-time salary benchmarking for the capabilities identified as gaps. When the workforce gap analysis identifies that cloud architecture capability needs to be acquired externally, the compensation data tells you exactly what that will cost in your specific labor market today, not what it cost when the benchmark report was last published.
See how INOP connects workforce gap analysis to live skills demand signals and real-time compensation benchmarks.
Book your demo today and explore what a continuously updated workforce gap analysis built for your organization would look like.
Tools for Workforce Gap Analysis: What Works at Each Scale
The right tool depends on your organization’s size, technical maturity, and how frequently the analysis needs to run.
Workforce intelligence platforms. Purpose-built platforms handle the full cycle across all five gap dimensions: capability assessment, headcount modeling, structural analysis, external market benchmarking, and financial impact modeling. INOP’s strategic workforce planning platform connects verified gap data across capability, headcount, role-value, mobility, and strategic execution risk to the BBRA intervention framework with financial trade-offs across four time horizons. The output is not a static gap report. It is a live decision intelligence layer that surfaces gaps as they emerge rather than when they are discovered in an annual review.
HRIS skills modules. Platforms like Workday, SAP SuccessFactors, and Oracle HCM have built-in skills frameworks. The advantage is integration with existing employee data. The limitation is that these modules focus on the capability dimension only, and their taxonomies update slowly. They work best as a data source feeding into a broader workforce gap analysis rather than as the analytical platform itself.
Assessment platforms. For technical role families where objective capability verification is essential, platforms like HackerRank, Codility, and Mercer Mettl provide the verification layer that self-assessment and manager review cannot. These are most effective as one input into a multi-source assessment model rather than as standalone workforce gap analysis tools.
Spreadsheet-based analysis. For organizations with fewer than 50 employees, a well-structured spreadsheet covering all five gap dimensions delivers meaningful results. The bottleneck is scale and refresh frequency: manual spreadsheet analysis breaks down at multi-department or multi-geography scope and requires discipline to maintain beyond the first cycle.
The Most Common Mistakes That Invalidate Workforce Gap Analyses
Analyzing only the capability dimension. A skills gap analysis is a component of a workforce gap analysis, not a substitute for it. Organizations that assess only capability routinely miss structural gaps, headcount gaps, and concentration risks that are often more strategically significant than the skill proficiency gaps the analysis surfaces.
Relying on self-assessment as the primary data source. Self-assessment is a useful starting point but insufficient as a standalone. Individuals consistently overestimate proficiency in areas of low knowledge and underestimate expertise in areas where they are outliers. Always combine self-assessment with manager evaluation and at least one objective verification method for any gap that will drive significant investment decisions.
Conducting the analysis without a plan to act on it. A workforce gap analysis that produces a comprehensive report and generates no action plan within 30 days will demotivate the employees who participated. Before running a comprehensive analysis, confirm that executive sponsorship, budget, and manager participation commitments are in place to act on the findings.
Treating the analysis as an annual event. Skills demand signals can shift meaningfully within a single quarter, and headcount requirements change as strategy evolves. Build quarterly pulse checks into the operating model for high-priority gaps and establish triggers, such as new technology adoption, role redesign, or significant market shifts, that prompt rapid reassessment outside the normal cycle.
Separating the gap analysis from the financial model. A gap finding without a cost-of-inaction figure and a cost-of-intervention figure is an analytical observation, not a business tool. Every prioritized gap needs the financial translation that makes it defensible in a capital allocation conversation. INOP’s Finance lens and BBRA framework provide exactly this structure, ensuring every gap recommendation arrives with the financial model that makes it actionable at the board level.
Confusing a gap with a motivation problem. Not all workforce gaps have the same root cause. Some result from insufficient development investment. Others reflect hiring decisions where the person never had the required skill. Some are structural barriers where employees cannot apply a skill because the role design does not require it. Some are motivation gaps where the skill exists but is not applied due to disengagement. The intervention appropriate for each cause is completely different, and misdiagnosing the root cause produces expensive interventions that close the wrong problem.
Measuring the ROI of Your Workforce Gap Analysis
Executive stakeholders need workforce gap analysis to be justified in financial terms. The following metrics translate gap analysis outcomes into the language that CFOs and boards respond to.
Internal fill rate improvement. What percentage of open roles were filled by internal candidates identified through the gap analysis rather than external search? Each internal fill avoids 30 to 60% of the external recruitment cost for that role. Nearly 40% of leaders report their skills gap has worsened in the last year, making the case that proactive gap analysis and internal mobility investment are more cost-effective than reactive external hiring.
Reduction in concentration risk incidents. How many roles that the analysis flagged as carrying single-point-of-failure concentration risk have been de-risked through development or structural change? Each incident avoided, measured as the cost of the programme disruption or knowledge loss that would have resulted, represents a direct return on the analysis investment.
Project delivery improvement. For organizations using the gap analysis to staff critical projects against verified capability profiles rather than assumed credentials, track project delivery outcomes before and after. Avoided project failures, each carrying costs typically ranging from 50 to 200% of the project budget, represent the clearest financial ROI the initiative can document.
Training spend efficiency. What percentage of training investment is directed at identified priority gaps versus general catalog usage? Organizations that use gap analysis to direct L&D spend report significantly higher ROI per training dollar than those using general access models, because investment is concentrated where the strategic need is greatest.
Attrition reduction in critical roles. When employees in roles identified as capability-critical receive visible development investment and clear progression pathways connected to their gap closure, voluntary attrition in those roles decreases. Track attrition separately for roles included in the gap analysis compared to roles not yet assessed.
Conclusion
A workforce gap analysis is not an HR audit exercise. It is a strategic planning tool that translates the distance between your current workforce and your future strategy into a prioritized, financially modeled action plan. The organizations closing that distance fastest in 2026 are not running better training programs. They are running more rigorous analyses, across all five gap dimensions, connected to financial models, external market intelligence, and BBRA-driven intervention frameworks that produce decisions rather than reports.
The five examples in this article illustrate the breadth of what a complete workforce gap analysis surfaces: skill proficiency gaps that training can close, structural gaps that require role redesign, concentration risks that require deliberate de-risking, headcount gaps that require external hiring, and strategic alignment gaps that require redeployment of existing capability toward the business functions that matter most to the plan.
INOP’s strategic workforce planning platform is built to make this analysis continuous rather than periodic, connected to live external market signals rather than static internal data, and financially modeled in terms that boards and investment committees can act on. If you want to explore what a workforce gap analysis looks like built for your specific organization, the most direct path is a conversation with our team.
If you are running or planning a workforce gap analysis in your organization and want to share what you are finding, leave a comment below. The most useful frameworks in this space come from practitioners working through the problem, not from templates describing it.
Frequently Asked Questions
What is a workforce gap analysis?
A workforce gap analysis is the structured process of comparing your organization’s current workforce state, across skills, roles, headcount, capability depth, and organizational alignment, against what your strategy will require to execute successfully. It is broader than a skills gap analysis, which focuses only on capability. A workforce gap analysis captures five dimensions simultaneously: capability gaps, headcount gaps, role and structural gaps, concentration and distribution gaps, and strategic alignment gaps. The output is a prioritized, financially modeled map of where investment in training, hiring, restructuring, redeployment, or automation will generate the highest return for the strategy at hand.
What is the difference between a workforce gap analysis and a skills gap analysis?
A skills gap analysis asks whether employees have the capabilities their roles require and produces a development plan to close proficiency shortfalls. A workforce gap analysis asks a larger set of questions: are there enough people, in the right roles, with the right skills, structured in the right way, to execute the strategy? A skills gap analysis is a component of a workforce gap analysis. Organizations that run only a skills gap analysis frequently miss structural gaps, headcount gaps, and capability concentration risks that are often more strategically significant than the proficiency shortfalls the skills analysis surfaces.
How often should a workforce gap analysis be conducted?
A comprehensive workforce gap analysis should be conducted annually and aligned to the strategic planning cycle. High-priority gaps in fast-moving dimensions, particularly capability in technology roles, leadership succession, and AI adoption, warrant quarterly pulse checks. Organizations undergoing significant change, including acquisitions, transformations, or market entries, should run a targeted analysis within the first 60 to 90 days of the change event rather than waiting for the next annual cycle. The most sustainable model integrates lightweight gap monitoring into existing performance management cycles rather than running it as a standalone annual project.
What is INOP’s BBRA framework and how does it apply to workforce gap analysis?
BBRA stands for Build, Buy, Redeploy, and Automate. It is INOP’s proprietary decision architecture for translating gap analysis findings into workforce action. For any prioritized gap, INOP models all four intervention pathways with financial trade-offs across 30-day, 180-day, 1-year, and 3-year horizons. Build models internal development cost and time-to-competency. Buy factors in market availability and real-time compensation benchmarks from INOP’s data across 3.5 million global job postings and 16 countries. Redeploy scores skills adjacency and reskilling feasibility for internal candidates. Automate quantifies FTE displacement and cost impact across time horizons. This gives leaders investment-grade rigour on every workforce decision the gap analysis produces.
How do PE operating partners use workforce gap analysis?
Operating partners use workforce gap analysis during diligence to identify the capability, structural, and concentration risks in a target’s workforce that are not visible in financial statements but carry direct financial consequences for the value creation plan. During the value creation period, the analysis identifies where automation can accelerate efficiency, which roles need redesign, what reskilling investment is required, and where external hiring is the only viable path within the required timeline. INOP’s platform connects the workforce gap baseline directly to financial scenario modelling, allowing operating partners to present the board with a workforce-adjusted version of the value creation plan within 90 days of close.
Can a workforce gap analysis be done in a spreadsheet?
Yes, for organizations with fewer than 50 employees or running a first analysis, a well-structured spreadsheet covering all five gap dimensions is entirely adequate. The limitations become significant at scale: aggregation across departments, version control across multiple managers, and refresh frequency all become manual bottlenecks at 100 or more employees. At that scale, a dedicated workforce intelligence platform produces more reliable and more actionable analysis for the same HR investment, because it maintains a live view rather than a point-in-time snapshot.
How does a workforce gap analysis connect to succession planning?
Succession planning without workforce gap data defaults to seniority and visibility as the primary selection criteria. A workforce gap analysis changes the succession question from “who do we think could do this role” to “whose current capability profile is closest to what this role requires, what is the development distance to readiness, and where is that person currently sitting in the organization.” When potential successors are assessed against all five gap dimensions, the succession pool frequently includes employees who would not be nominated through a traditional manager-nomination process because they are less visible, but whose verified capability proximity makes them stronger development investments with lower transition risk.
Make confident workforce decisions that support strategy and value creation.