Workforce forecasting mistakes are rarely visible when they happen. They surface three to six months later, in a missed product launch, a retention crisis in an understaffed team, or a budget conversation where the CFO asks why headcount spend is 40% over plan for the third consecutive quarter. By the time the damage is visible, the decision that caused it is long past.
This guide examines the eight most consequential workforce forecasting mistakes organizations make in 2026, what each one costs in financial terms, and how to fix each one before it compounds into a talent or business crisis. If your organization is experiencing chronic reactive hiring, unexpected attrition among high performers, or persistent skills gaps that training programs keep failing to close, you will find the structural root cause of at least one of those problems here.
What Workforce Forecasting Mistakes Actually Cost: The Hiring Whiplash Pattern
Before examining individual mistakes, it helps to name the pattern they collectively produce. In enterprise environments, workforce forecasting failures manifest as hiring whiplash: sudden headcount freezes that strand open requisitions, rushed mass hiring when demand signals finally arrive, chronically overloaded teams in the gaps between these cycles, and a recruiting function that operates permanently in reactive mode.
Hiring whiplash is not a recruiting problem. It is a forecasting architecture problem. Recruiters cannot outperform the planning system they are executing against. When the forecast is wrong, the recruiting team absorbs the cost in the form of premium agency fees, compressed timelines, and declining offer acceptance rates from candidates who accepted competitor offers during the delay.
The financial arithmetic is specific. Organizations that hire reactively, when a gap has already become a business crisis, pay 20 to 30% more in agency fees than those with proactive pipelines. For a company making 100 professional hires annually with average salaries of $90,000, reactive hiring adds $540,000 to $810,000 in annual recruitment spend compared to a proactive model. That figure does not include the productivity cost of understaffing during the lag between need identification and hire onboarding, which for senior technical roles typically runs $75,000 to $120,000 per role per month of vacancy.
Top talent, who have options, read these cycles accurately. Extended approval processes, hiring freezes followed by rushed recruitment, and chronic team understaffing are all signals that organizational leadership does not have reliable visibility into its own workforce. High performers respond by accepting offers from organizations that appear more operationally grounded. The talent loss from forecasting failure is real, it is compounding, and it is almost never attributed to its actual cause.
For a complete framework on building a forecasting architecture that eliminates this cycle, INOP’s guide on workforce forecasting covers the methodology from static to predictive planning in depth.
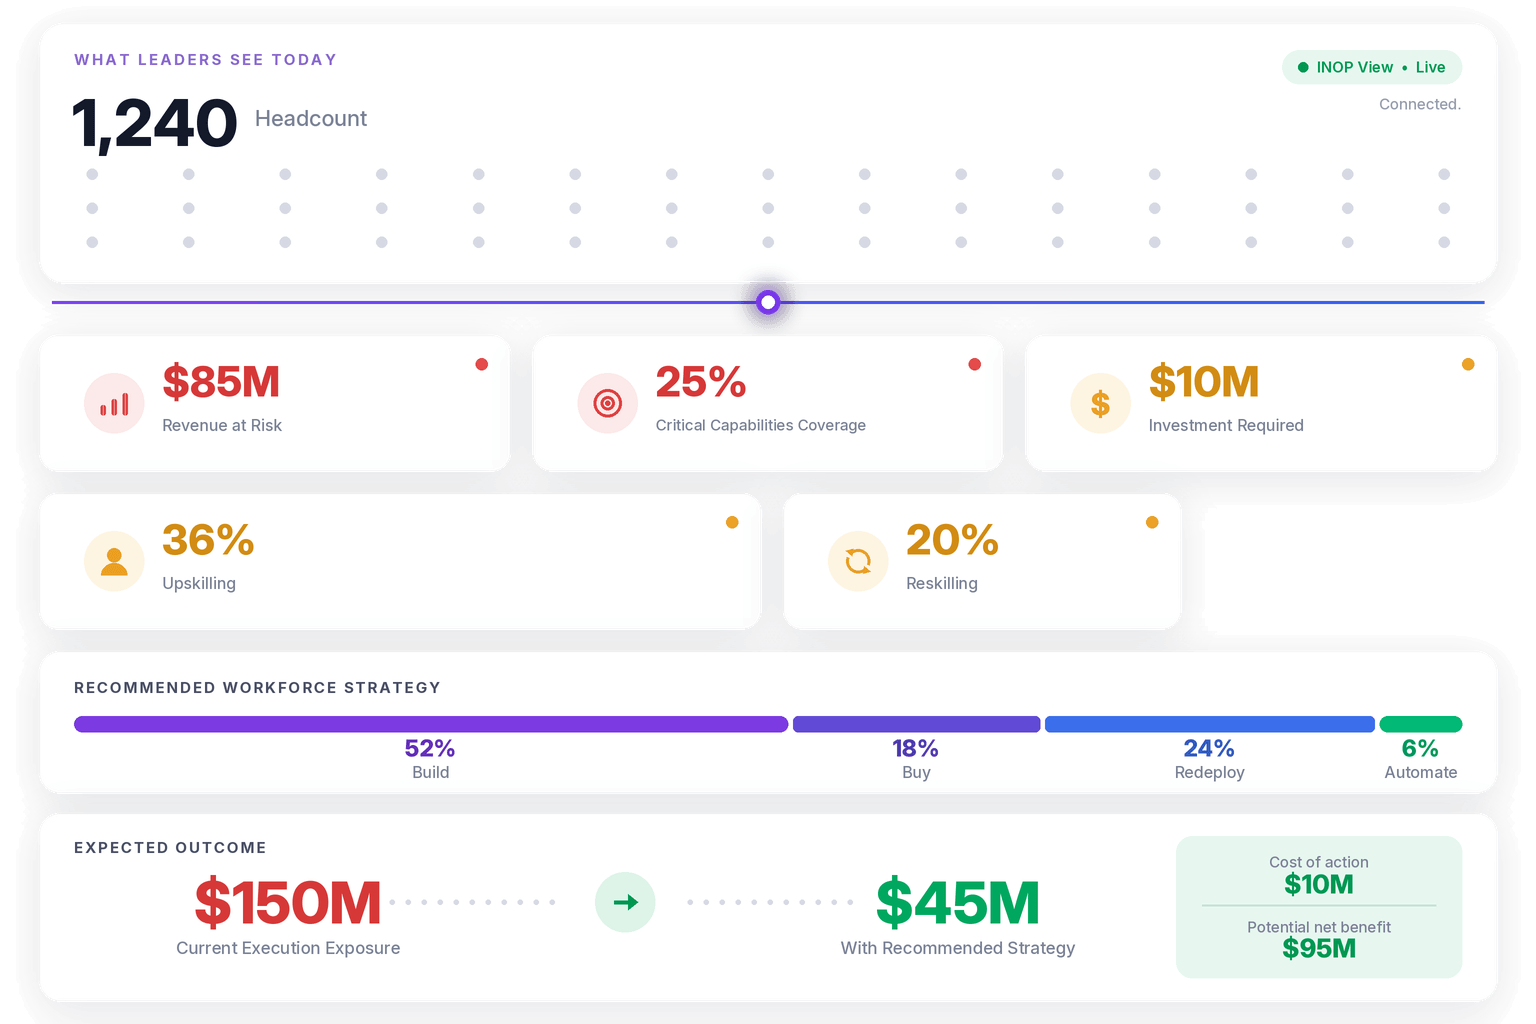
Is your organization caught in a hiring whiplash cycle? See how INOP’s workforce intelligence platform breaks the pattern in a 20-minute demo.
Mistake 1: Building a Headcount Model Instead of a Capability Model
The most foundational workforce forecasting mistake is not a data quality problem or a technology gap. It is an architectural one. Most organizations still build workforce forecasts as headcount tables rather than as capability supply-and-demand models, and that structural choice determines everything downstream.
A headcount table answers: how many people do we have in each role, and how many do we expect to add or lose? A capability supply-and-demand model answers: what skills does the business need to execute its strategy at each planning horizon, what capabilities does the current workforce actually hold and at what proficiency level, what will we lose through attrition and retirement before the plan executes, and what does it cost and how long does it take to close each gap through each available route?
Only 18% of CHROs say their organization consistently uses data analytics to guide people decisions, with most still relying on gut feel according to Korn Ferry’s 2025 CHRO survey. The distance between a headcount table and a capability model is the distance between a planning artifact and decision-grade intelligence. Organizations making the structural shift from headcount planning to capability modeling report 20 to 35% improvement in planning accuracy and significantly reduced reactive hiring costs.
The fix: Rebuild your forecasting model around three connected layers. First, a skills supply model that tracks capability changes through attrition, development velocity, and skill decay, not just employee count. Second, a demand model that connects business driver assumptions directly to capability requirements rather than to last year’s headcount plus a percentage adjustment. Third, scenario comparison that produces the workforce and financial implications of three or four planning assumptions simultaneously rather than a single plan that breaks whenever the environment shifts.
Mistake 2: Using Historical Data as a Proxy for Future Demand
Historical workforce data is necessary context. It is not a reliable forecast. Organizations that build workforce plans primarily from historical hiring patterns and headcount trends are making a structural assumption that the future will resemble the past, precisely at the moment when technological disruption, AI adoption, and skills obsolescence are accelerating the rate at which that assumption fails.
The specific failure mode: a company whose data processing team grew at 12% annually for five years builds a 2027 headcount plan assuming the same growth rate. An AI tool deployed in month four of the plan eliminates 70% of the processing work that growth assumption was based on. The headcount plan is now materially wrong before it is halfway executed, and the organization faces either over-hiring against evaporated demand or a disruptive restructuring of a team that was never needed at the planned scale.
Skills decay compounds the historical data problem. Skills that were strategically critical three years ago may be commoditizing. Skills that are emerging in the market may not exist in any historical hiring record. A forecast built exclusively from historical data systematically underweights the capabilities the business will need most and overweights the capabilities it has been accumulating for years.
The fix: Combine historical trend analysis with three forward-looking inputs: real-time labor market data showing which skills are gaining or losing market value, business driver projections from the strategic plan that connect growth assumptions to capability requirements, and scenario modeling that stress-tests the forecast against disruption scenarios rather than only the base case. For organizations assessing which external skills signals to incorporate, INOP’s skills intelligence platform tracks external demand signal states across four categories: Emerging, In Demand, Stable, and Declining, giving forecasters a live view of market skill dynamics rather than a lagging survey.
Mistake 3: Ignoring Skills Decay in Supply-Side Modeling
Most workforce forecasters count the skills their organization currently has and assume those skills will be available at the same value throughout the planning horizon. This assumption is wrong for two reasons that compound each other.
First, skills decay. A cloud architecture skill assessed as advanced two years ago may be intermediate today if the technology has advanced and the employee has not kept pace. A machine learning skill certified against the 2022 framework may not reflect current production requirements. Planning that counts certified skills without modeling their decay rate systematically overstates the organization’s actual future capability.
Second, attrition carries skill loss that headcount replacement does not fully offset. When a senior engineer with ten years of proprietary system knowledge departs, the replacement hire brings technical skill at the required level but not the institutional knowledge. The headcount plan records the replacement as a like-for-like substitution. The capability model recognizes a net capability decline that will take 12 to 18 months to recover.
The fix: Build skill decay assumptions into your supply model based on the half-life of capabilities in each role family. Technical skills in fast-moving domains like AI development, cloud infrastructure, and cybersecurity need decay modeling at 12 to 18 month intervals. Professional skills in more stable domains can be modeled at two to three year intervals. Connect attrition projections to skill-level loss estimates, not just headcount loss estimates, so the forecast reflects what is actually leaving the organization rather than just how many people are leaving.
Mistake 4: Forecasting Without Finance Integration
Workforce forecasting conducted in isolation from financial planning produces two forecasts that cannot be reconciled rather than one integrated plan. HR builds a workforce plan in Q3 based on strategic capability requirements. Finance builds a headcount budget in Q4 based on cost targets. They rarely share assumptions, use different headcount definitions, and produce outputs that diverge by 15 to 30% before anyone notices the gap.
The consequence is a planning process where both functions end up right about something and wrong about something else: HR correctly identifies the capability requirements but cannot get them approved because Finance has already set a cost envelope that does not accommodate them; Finance correctly manages the cost envelope but cannot explain to the CEO why the strategic plan is understaffed three months into execution.
According to Russell Reynolds Associates’ 2024 CHRO analysis, today’s CHROs spend 80% or more of their time working with senior stakeholders on transformation, C-suite succession, and future of work preparedness, with some carrying explicit board-level responsibility for workforce and risk. That level of strategic accountability requires workforce forecasts that Finance trusts and can audit, not plans produced on a separate cycle in different systems.
The fix: Build the workforce forecast and the financial plan from shared assumptions, in a shared system, with aligned definitions. Workforce cost should be modeled as a capability investment with a projected return, not as a headcount expense line. The financial implications of each planning scenario should be visible alongside the workforce implications so that decision-makers can evaluate trade-offs rather than optimizing one dimension while the other creates problems off-screen. For more on connecting workforce forecasting to financial planning cycles, INOP’s guide on workforce planning tools for strategic decision-making covers the FP&A integration in detail.
Mistake 5: Underestimating Internal Mobility as a Forecasting Variable
Internal mobility is the most underutilized variable in workforce forecasting. Most headcount plans treat all open roles as requiring external hires by default, with internal candidates as an occasional exception that happens when a manager happens to know someone. This default produces systematically inflated external hiring costs and systematically underdeveloped internal talent.
Organizations with mature skills visibility and internal mobility programs fill 40 to 60% of roles that were previously filled externally through internal redeployment. Each internal fill saves 30 to 60% of the equivalent external recruitment cost and eliminates the three to six month productivity ramp that external hires require. The talent retention benefit compounds: employees who see visible internal development pathways stay longer, removing attrition-driven demand from the external forecast.
The forecasting problem is that internal mobility is invisible without skills data. A workforce plan built on job titles and org chart positions cannot surface the data analyst with adjacent machine learning skills who could fill a data science vacancy, or the operations manager with financial modeling capability who could step into a finance business partner role. Without skills visibility, the forecast assumes external hiring is the only option because no other option is visible.
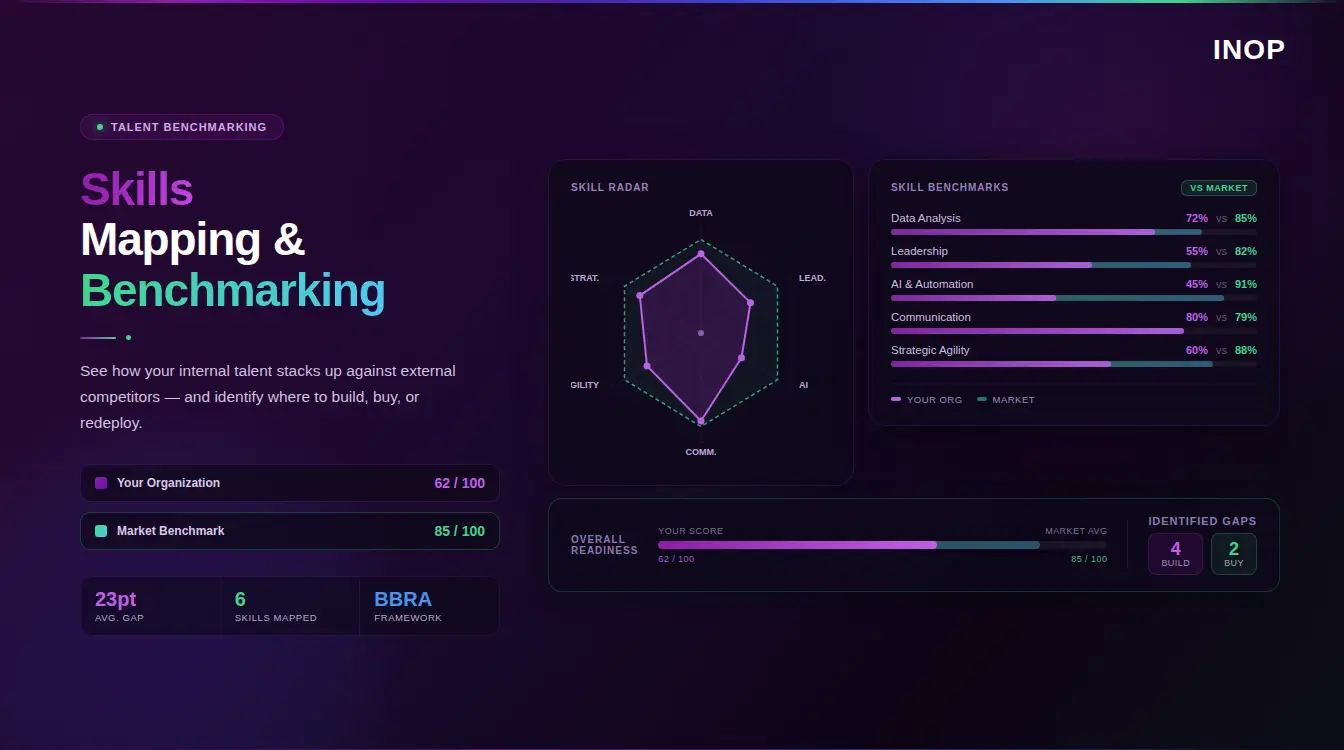
The fix: Build internal mobility modeling into the supply side of your workforce forecast. For each projected role vacancy, run a skills proximity search against the current workforce before modeling external hiring cost and timeline. Quantify the internal fill rate assumption in your forecast explicitly, track it against actual outcomes, and adjust the assumption as your skills data and mobility programme mature. For a practical guide on surfacing internal capability that your headcount model cannot see, INOP’s article on how to spot hidden talent inside your organization covers the identification methodology.
Mistake 6: Failing to Model AI Automation Risk in the Demand Forecast
Most workforce demand forecasts in 2026 are built as if AI adoption will follow a gradual, predictable trajectory that annual planning cycles can track. In practice, AI automation is restructuring task compositions and role requirements on timescales that outpace annual planning cadences. Organizations forecasting 2027 and 2028 headcount using current role definitions are building plans against a demand landscape that will shift materially before those plans execute.
The specific failure mode is role-level demand collapse. An organization forecasts needing 35 additional financial analysts based on projected transaction volume growth. An AI tool deployed in month six handles 65% of the analysis workload that headcount requirement was based on. The demand assumption was built without modeling the probability that automation would change the task composition of that role family within the planning horizon. The result is over-hiring, restructuring, and the reputational damage that accompanies workforce actions that good forecasting should have prevented.
The inverse failure is equally costly: organizations that model automation risk as certain and cut headcount plans aggressively discover that AI adoption takes longer than projected and that they lack the human capability to fill the gap during the transition period. Both errors stem from treating AI adoption as a binary event rather than a probabilistic range across time horizons.
The fix: Add an AI automation scenario layer to your workforce demand model. For each major role family in the forecast, assess the probability that AI tools will materially change the task composition within the 12-month, 24-month, and 36-month planning horizons. Model three scenarios: conservative adoption (your current plan), moderate adoption (20 to 40% task automation within 18 months), and accelerated adoption (40 to 60% task automation within 12 months). The range of headcount requirements across these scenarios gives you a realistic planning envelope rather than a false precision point estimate.
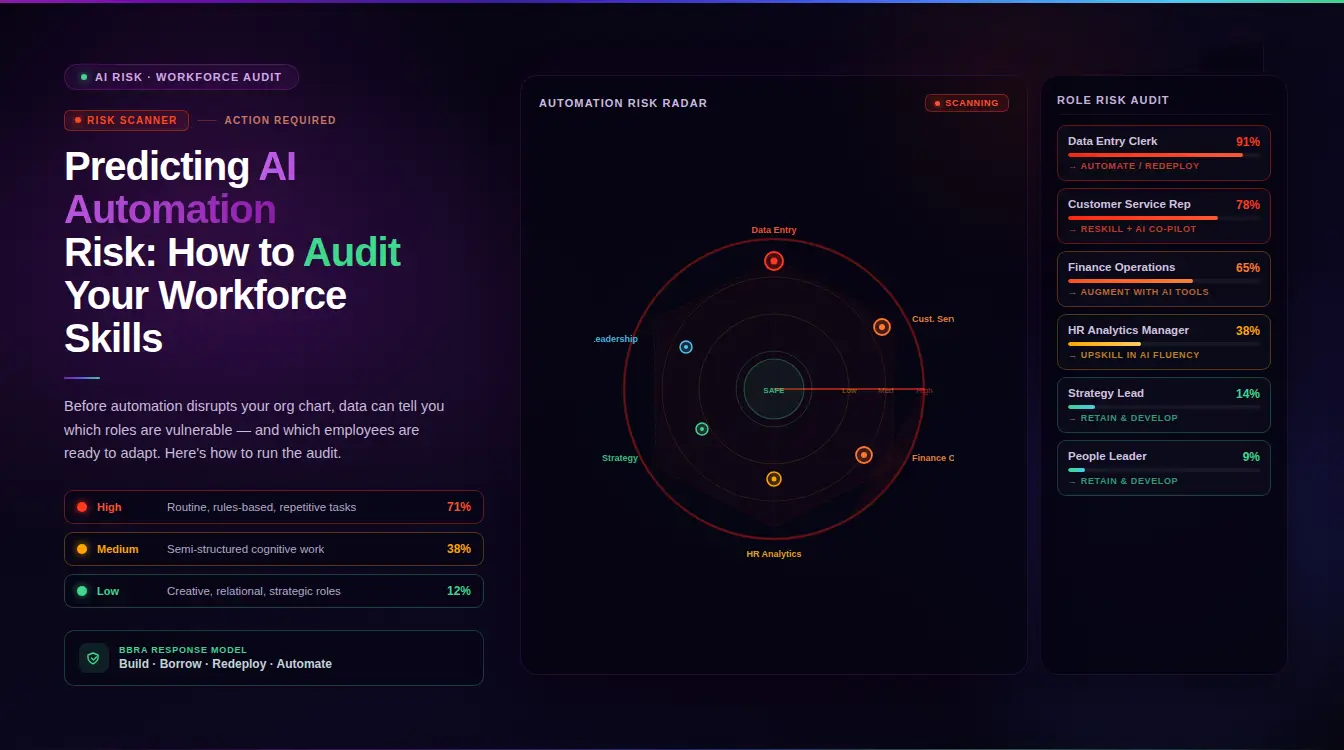
INOP’s AI and Automation intelligence domain applies task-level analysis across 40,000 or more roles using seven published research frameworks, producing automation susceptibility scores across six dimensions and four time horizons for every role in the organization. For the audit methodology that feeds this analysis, INOP’s guide on predicting AI automation risk covers the complete process from task mapping to scenario modeling.
Mistake 7: Excluding the Contingent Workforce from the Forecast
The contingent workforce mistake has evolved from a simple omission to a structural planning problem. Three years ago, the primary error was failing to include contingent workers in headcount planning at all. In 2026, the more costly mistake is treating contingent workforce planning as a separate procurement function disconnected from the strategic workforce plan.
AMS research estimates that approximately 38% of the US workforce is already contingent, with projections placing that figure at 50% by 2035. At that scale, managing contingent labor as transactional procurement rather than as integrated workforce capacity planning produces three specific and compounding failure modes.
The first is rate overspend. When contingent workers are engaged reactively, organizations pay spot market rates rather than rates negotiated through planned engagement. The difference typically runs 15 to 35% above budgeted rates, and by the time Finance sees the variance, the spend has already occurred and the corrective action lands in next quarter’s plan rather than this quarter’s budget.
The second is invisible capability concentration. An organization whose strategic plan assumes 200 FTEs with specific technical capabilities may actually be operating with 160 permanent staff and 40 contractors who hold critical skills. If those contractors are excluded from the skills inventory and workforce plan, the permanent workforce headcount overstates the organization’s actual capability depth, producing false confidence about execution readiness. When a key contractor engagement ends, the plan has no record that a critical capability dependency existed.
The third is workforce cost forecast inaccuracy. When contingent workers are excluded from workforce cost models, finance teams produce headcount cost projections that understate actual total labor spend by 20 to 40% in organizations with significant contractor populations. This gap compounds quarterly as it forces mid-period budget revisions that erode Finance’s confidence in HR-produced forecasts.
The fix: Integrate contingent workforce data, including assignment durations, skill profiles, cost rates, and renewal probabilities, into the same planning model as permanent workforce data. Build a total workforce view rather than a permanent headcount view. Flag critical skill concentrations in the contingent population as capability dependencies that require either conversion to permanent roles or explicit succession planning before engagement end dates.
Mistake 8: Treating Workforce Forecasting as an Annual Event
Annual workforce planning cycles were designed for stable business environments where role requirements, technology landscapes, and competitive dynamics changed slowly enough that a once-yearly reset was sufficient. That environment no longer exists for most organizations, and annual-only forecasting has become the primary reason workforce plans are obsolete before they are published.
The symptoms of annual-cycle forecasting failure are recognizable. A business unit submits a headcount request for a capability that the workforce plan already identified as a gap, but the planning cycle does not open for another four months. An AI disruption changes the task composition of a key role family in month three of a twelve-month plan, but the plan is not adjusted until the next annual cycle. An attrition spike in a critical function is not reflected in the workforce model until the next planning season, by which point the recruiting and development responses have already launched against stale data.
The organizations that compound the most forecasting value run continuous planning with a quarterly refresh cycle, not annual planning with monthly reporting of variance against a static plan. Continuous planning does not mean rebuilding the model every month. It means building a model flexible enough that business driver changes, attrition signals, and skills data updates flow through the forecast automatically rather than requiring a manual rebuild.
The fix: Establish a quarterly planning cadence with two components: a lightweight pulse review that updates key demand drivers and attrition signals against the current plan, and an annual comprehensive reassessment that rebuilds the taxonomy, role requirements, and strategic alignment from the ground up. Build trigger-based updates for material changes: a significant attrition event, a strategic pivot, or a technology adoption decision should each prompt an unscheduled model update rather than waiting for the next quarterly cycle. For the role of AI in making continuous forecasting operationally sustainable, INOP’s guide on the role of AI in smarter workforce forecasting covers the automation layer that makes real-time updates feasible without manual rebuild effort.
The Financial Cost of Getting Workforce Forecasting Wrong
Workforce forecasting failures do not appear as a single identifiable cost on any budget line. They distribute across multiple cost centers in ways that make attribution difficult and executive accountability diffuse. Naming the cost categories makes the investment case for better forecasting concrete.
Reactive hiring premium: Organizations hiring reactively pay 20 to 30% above market rates in agency fees, sign-on bonuses required to compete in compressed timelines, and premium rates from contingent staffing firms engaged under urgency terms. For an organization making 100 professional hires at average salaries of $90,000, this premium runs $540,000 to $810,000 annually above what a proactive model would cost.
Vacancy productivity gap: For every month a strategic role remains vacant, the organization absorbs a productivity cost equal to the role’s contribution to output. For senior technical roles earning $150,000 annually, the productivity gap during a six-month vacancy runs $75,000 to $120,000, before accounting for the overtime and morale cost absorbed by the remaining team covering the gap.
High performer attrition during instability cycles: Voluntary attrition among high performers increases measurably during hiring freeze and surge cycles. Replacing a high performer costs 150 to 200% of annual salary when lost institutional knowledge, recruiting cost, and productivity ramp are included. An organization losing five high performers per year to forecasting-driven instability is absorbing $1.1 million to $1.5 million in replacement cost that proper forecasting would eliminate.
Misaligned training spend: Organizations without capability supply modeling invest training budgets against role categories rather than against verified individual gaps. Research consistently shows that 30 to 40% of training spend in organizations without skills gap data produces no measurable capability change, because the training is not targeted to actual gaps. For a $1 million annual L&D budget, that misalignment represents $300,000 to $400,000 in wasted investment annually.
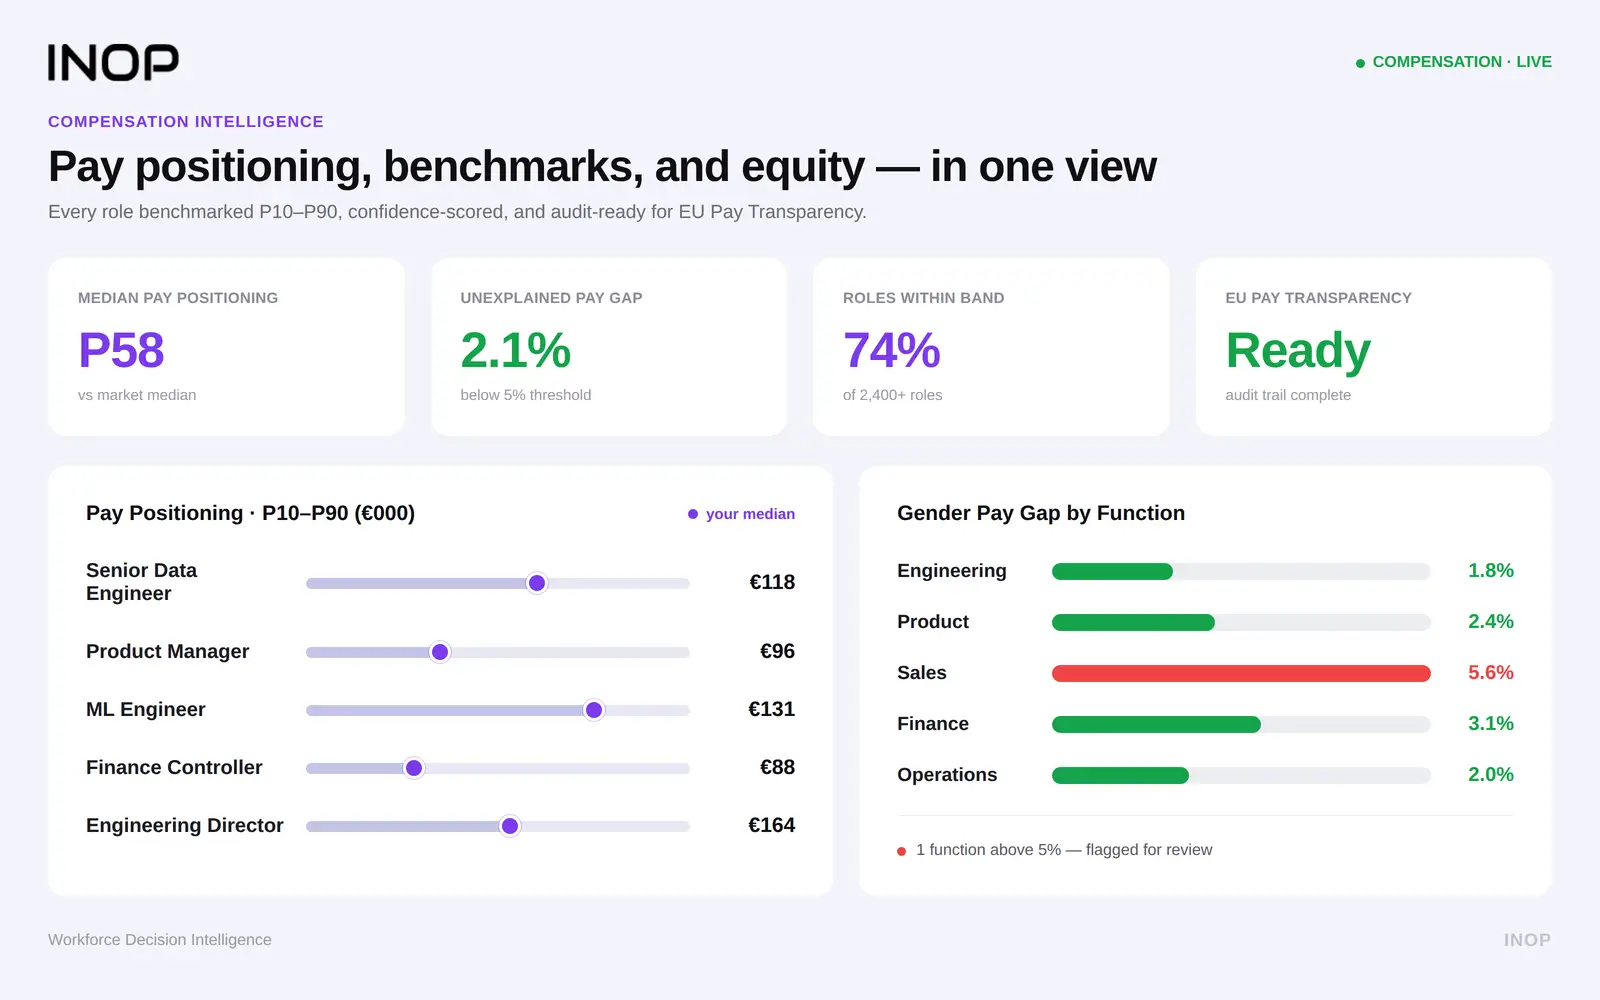
For more on connecting workforce cost modeling to compensation analytics, INOP’s compensation analytics platform connects skills-based pay band data to real-time market benchmarks, ensuring that the financial model accounts for market premium drift in high-demand skills rather than using static salary averages.
Building a Forecasting System That Avoids These Mistakes
The organizations that avoid hiring whiplash and talent loss share an architectural pattern rather than a specific technology choice. They have built forecasting systems with four structural properties that individually address each of the mistakes above.
Driver-based demand modeling. Headcount requirements update automatically when business driver assumptions change, rather than requiring HR to rebuild the model manually for each scenario Finance wants to test. A 10% revenue growth assumption recalculates required headcount by function and level; a product launch adds the capability requirements automatically; a technology deployment updates the automation risk model without a manual intervention.
Skills-level supply modeling. The supply side of the forecast tracks capability changes through attrition, development velocity, and skill decay, not just employee count. The model knows not just that 12 engineers are projected to leave next year but which capabilities those engineers hold, how long those capabilities take to replace or develop, and what the cost comparison between the two routes looks like.
Total workforce integration. Permanent employees, contingent workers, and internal mobility candidates are all part of the same planning model. The forecast reflects actual total workforce capability and cost rather than permanent headcount alone.
Continuous update capability. The model updates when business drivers change, when attrition signals arrive, and when skills data changes, rather than waiting for the next annual planning cycle to incorporate new information that is already affecting execution.
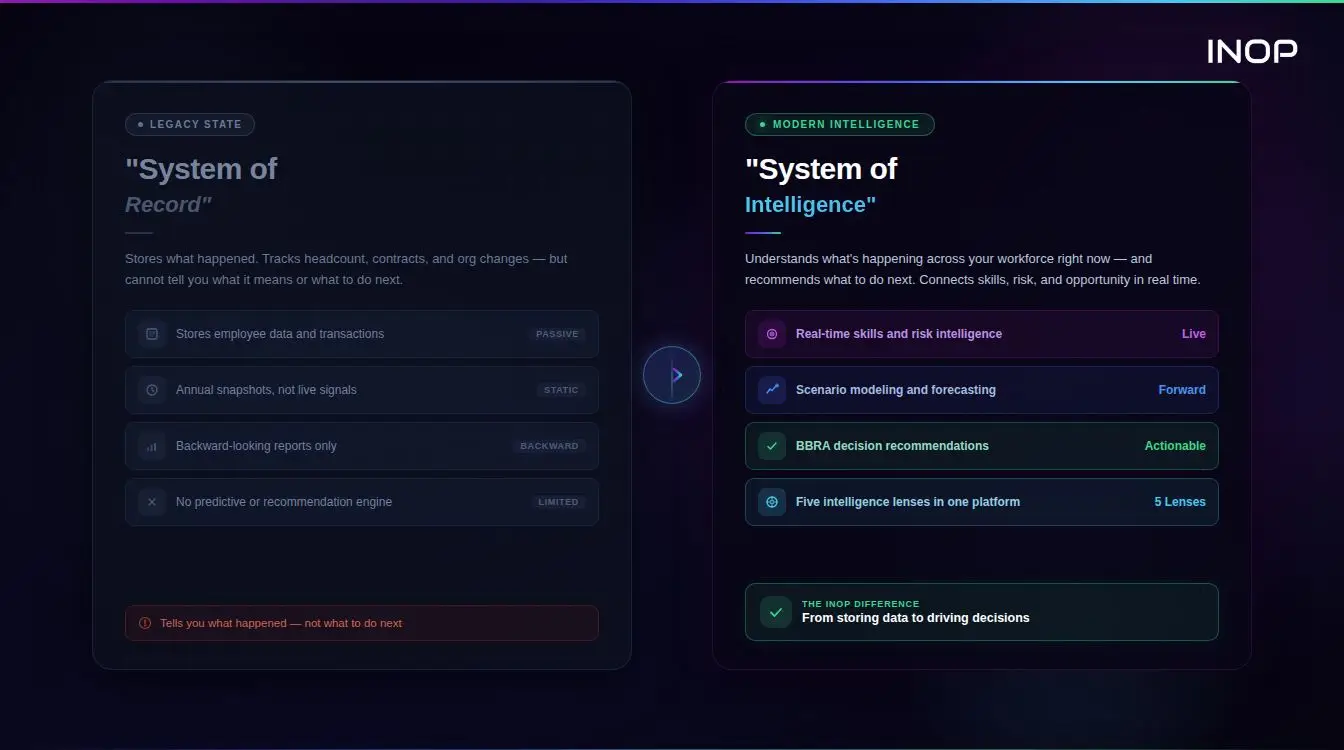
INOP’s strategic workforce planning platform is built around these four properties, connecting skills intelligence, financial scenario modeling, and external market data in a single planning layer that serves HR, Finance, and executive leadership from the same data source. For a broader view of how workforce intelligence connects to strategic business decisions, INOP’s guide on workforce decision intelligence covers the full framework.
Workforce Forecasting Mistakes in PE Portfolio Companies
For private equity operating partners, workforce forecasting mistakes carry a specific and time-compressed cost that differs from the general enterprise context. The hold period is finite, the value creation plan is specific, and the cost of forecasting errors compounds against a timeline where every quarter represents a material share of the investment horizon.
The three most consequential forecasting mistakes in PE portfolio contexts are distinct from the general list above. The first is assuming the acquired workforce has the capability to execute the value creation plan without conducting a structured capability baseline in the first 90 days. The assumption is almost always wrong in a specific direction: organizations have more hidden capability than their job titles suggest in some areas, and critical gaps that the value creation plan depends on closing in others. Neither dimension is visible without a skills-level assessment.
The second is failing to model key-person concentration risk as a forecasting variable. When two or three individuals hold capabilities that are critical to plan execution, the departure of any one of them creates a non-linear impact on the forecast. A headcount plan that shows 5% attrition as a manageable loss does not capture the scenario where that 5% includes the only person in the organization with deep knowledge of a proprietary system that the digital transformation plan depends on.
The third is using the acquired company’s historical growth trajectory as the demand model for the new strategic plan. The value creation plan typically assumes a growth rate or operational model materially different from the historical trajectory. Forecasting capability requirements from historical patterns produces a staffing plan for the company as it was, not for the company the value creation thesis requires it to become.
INOP’s strategic workforce planning platform supports PE operating partners with rapid capability baseline assessments, key-person risk quantification, and value-creation-plan-aligned headcount and skills forecasting, in a format that operating partners and investment committees can use directly for capital allocation decisions. For a view of how INOP’s workforce intelligence has supported documented PE portfolio outcomes, INOP’s workforce planning case studies cover the PE context in detail. Book a demo to see how INOP supports PE portfolio workforce intelligence.
Ready to move from reactive workforce planning to a system that anticipates talent needs before they become crises? See INOP’s workforce forecasting platform in a 20-minute demo.
Frequently Asked Questions
What is the most common workforce forecasting mistake?
The most costly and most structurally common mistake is building workforce forecasts as static headcount models rather than dynamic capability supply-and-demand models. Headcount planning tells you how many people you have and how many you expect to add. It does not tell you whether those people have the skills the business needs, how your skills supply is changing through attrition, development, and decay, or whether your demand assumptions hold under different technology or market scenarios. Organizations that shift from headcount planning to capability modeling report 20 to 35% improvement in planning accuracy and significantly reduced reactive hiring costs.
How does poor workforce forecasting cause top talent loss?
Poor forecasting produces the conditions that drive top talent departure at multiple points in the cycle. During over-hiring phases, performance management becomes inconsistent and high performers lose faith in organizational leadership judgment when they observe redundant hiring alongside unaddressed performance issues. During hiring freezes, teams become chronically understaffed and high performers absorb disproportionate workload, accelerating burnout. During rushed hiring phases, candidate quality suffers and poor-fit additions damage team culture. Top talent responds to sustained organizational instability by accepting offers from organizations that appear more operationally grounded. This talent loss is rarely attributed to forecasting failure because the causal chain is four to six months long.
What is the difference between workforce forecasting and workforce planning?
Workforce forecasting is the analytical process of projecting future talent needs based on business drivers, growth assumptions, attrition models, and skills supply data. Workforce planning is the broader strategic process that uses forecasting as one input alongside competitive intelligence, skills gap analysis, compensation benchmarking, and build-versus-buy analysis to produce a talent strategy and action plan. Forecasting answers “what will we need?” Planning answers “what will we do about it?” Forecasting without planning produces data that nobody acts on. Planning without forecasting produces strategy built on assumptions that may not reflect organizational or market reality.
How do you fix a broken workforce forecasting process?
The most effective repairs address the structural problem before the process problem. Audit the data inputs first: is your attrition model segmented by role family and level, or blended across the organization? Is your demand model driver-based, connecting business growth assumptions to headcount requirements, or based on last year’s plan plus a percentage adjustment? Is your skills supply model tracking capability changes rather than just headcount changes? Address these structural gaps before optimizing the process cadence or investing in new technology. A sophisticated platform producing forecasts from inadequate input data will produce sophisticated-looking forecasts that are wrong in ways that are harder to identify than a simple spreadsheet’s obvious gaps.
What role does AI play in workforce forecasting mistakes in 2026?
AI is both a source of new forecasting mistakes and a tool for fixing existing ones. On the mistake side, organizations that fail to model AI automation risk in their workforce demand forecasts are building headcount and skills plans against a role landscape that AI is reshaping faster than annual planning cycles can track. On the solution side, AI-powered workforce planning platforms provide real-time labor market intelligence, skills adjacency modeling, scenario simulation, and attrition prediction that make forecasting more accurate and more responsive than spreadsheet-based methods can achieve at scale. The key is using AI to improve the quality of forecasting inputs and scenario modeling, not using it to automate a structurally flawed forecasting architecture more efficiently.
How do contingent workers affect workforce forecasting accuracy?
Contingent workers affect forecasting accuracy in three ways when excluded from the plan. First, they create invisible capability concentrations: if critical skills are held by contractors who are not in the skills inventory, the permanent workforce plan overstates the organization’s actual capability depth. Second, they create cost forecast gaps: organizations with significant contractor populations that model only permanent headcount costs understate actual total labor spend by 20 to 40%, producing mid-period budget revisions that erode Finance’s confidence in HR-produced forecasts. Third, they create supply-side planning gaps: when contractor engagement end dates are not modeled in the workforce plan, the demand those engagements were meeting surfaces as an unexpected vacancy rather than as a planned transition.
What analytics tools support better workforce forecasting?
The tool landscape for workforce forecasting divides into three layers that serve different parts of the planning problem. Strategic workforce intelligence platforms, including INOP, Workday Adaptive Planning, Visier, and Anaplan, handle the demand modeling, scenario simulation, and financial integration layer. Skills assessment and gap analysis tools, including iMocha and TalentGuard, provide the skills supply data that capability-based forecasting requires. Labor market intelligence platforms, including Lightcast and LinkedIn Talent Insights, provide the external benchmarking that makes build-versus-buy decisions financially grounded rather than estimated. For a complete analysis of which tools serve which forecasting use cases, INOP’s guide on analytics tools for modeling future workforce requirements covers the full category.