83% of companies globally report low workforce analytics maturity, according to Deloitte research cited by AIHR’s 2026 workforce analytics survey. The gap is not a tool problem. Most organizations have access to the same platforms. The gap is a sequencing problem: they invest in platforms before establishing the data foundation those platforms need to produce trustworthy outputs, then discover six months later that Finance does not trust the outputs and the initiative loses budget.
This guide covers the analytics tools that actually help model future workforce requirements in 2026, organized by organizational tier and use case. It also covers what you need to have in place before any tool will work, the five predictive model types and what each addresses, how to calculate ROI from analytics investment, and how skills decay changes the reliability of workforce supply forecasts.
Want to see workforce analytics connected to financial decisions your CFO will trust? Book a 20-minute demo with INOP.
Why Modeling Future Workforce Requirements Matters in 2026
According to PwC’s 2026 CEO survey, 77% of executives cite talent availability as their biggest operational risk. That figure has held near the top of CEO concern surveys for four consecutive years, and the interventions most organizations are relying on have not moved it. Reactive hiring, annual workforce reviews, and generic upskilling programmes all address symptoms. They do not produce the six to eighteen month lead time that prevents a talent gap from becoming a delivery failure.
The World Economic Forum’s 2025 Future of Jobs Report found that 59% of workers will need upskilling or reskilling by 2030. For a 500-person organization, that means approximately 295 employees need materially different skills within five years. The organizations that build systematic analytics capability to identify which 295, in which sequence, and through which development pathway will spend that transition period executing. The ones that do not will spend it scrambling.
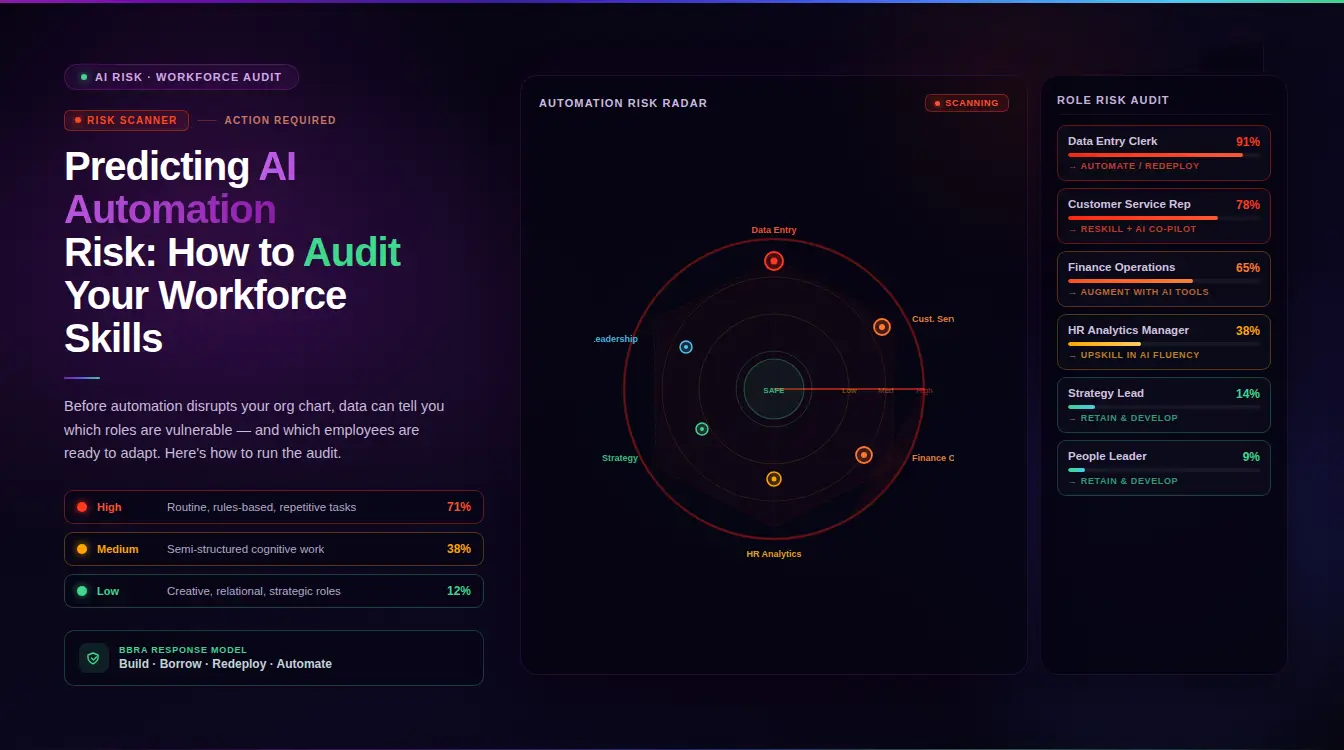
McKinsey’s 2025 Generative AI in the Workplace research adds a dimension that most workforce planning frameworks have not yet absorbed: 28% of routine knowledge tasks are now automatable. A 100-person headcount target in certain functions can be delivered with 75 to 80 people plus appropriate tooling. Workforce analytics that excludes automation scenarios from demand modeling systematically overestimates future human headcount requirements and leaves real cost savings off the table.
Calculating the ROI Before Selecting a Tool
The financial case for workforce analytics investment is most defensible when built from avoided costs rather than efficiency claims. Three cost categories produce the clearest calculation.
Avoided attrition replacement cost: your attrition model identifies 25 high-risk employees, proactive intervention retains 15 of them, and your average mid-level replacement cost is $90,000. That is $1.35 million in avoided cost from a single model type in a single year. Before the model existed, that cost was invisible until the departures registered in Finance’s quarterly headcount reconciliation.
Reactive hiring premium reduction: organizations running driver-based demand forecasting fill roles from proactive pipelines rather than emergency requisitions. Reactive hiring runs 19% to 30% more expensive per hire in agency fees and compressed timeline premiums. For 200 annual professional hires at $80,000 average salary, closing half the reactive premium gap produces $1.5 million to $2.4 million in annual savings.
Project delay avoidance: the cost of a digital transformation that runs three months behind schedule because the required cloud architecture capability was not available when needed often exceeds the entire annual analytics platform investment. When workforce analytics identifies that gap six months in advance, the project runs on schedule. That is the financial case that earns executive attention in a budget conversation.
The Data Foundation You Need Before Any Tool Will Work
Evaluating platforms before auditing your data is the most common reason workforce analytics initiatives fail to produce trusted outputs. A sophisticated platform running on inconsistent HRIS data, missing compensation records, and engagement surveys that were never mapped to individual employees produces reports that HR cannot defend. Finance stops trusting them. The initiative loses organizational support.
Run this audit before evaluating any tool:
Current headcount data needs to include every employee’s function, level, location, and manager relationship, updated no less frequently than monthly. Org chart data that is three months stale produces supply modeling errors that compound through every downstream calculation.
Attrition data needs to be segmented by role family, tenure band, and location rather than blended across the organization. A company-wide 14% attrition rate that hides 28% attrition in engineering and 8% in operations is useless for supply modeling in either function. You need the segments, not the average.
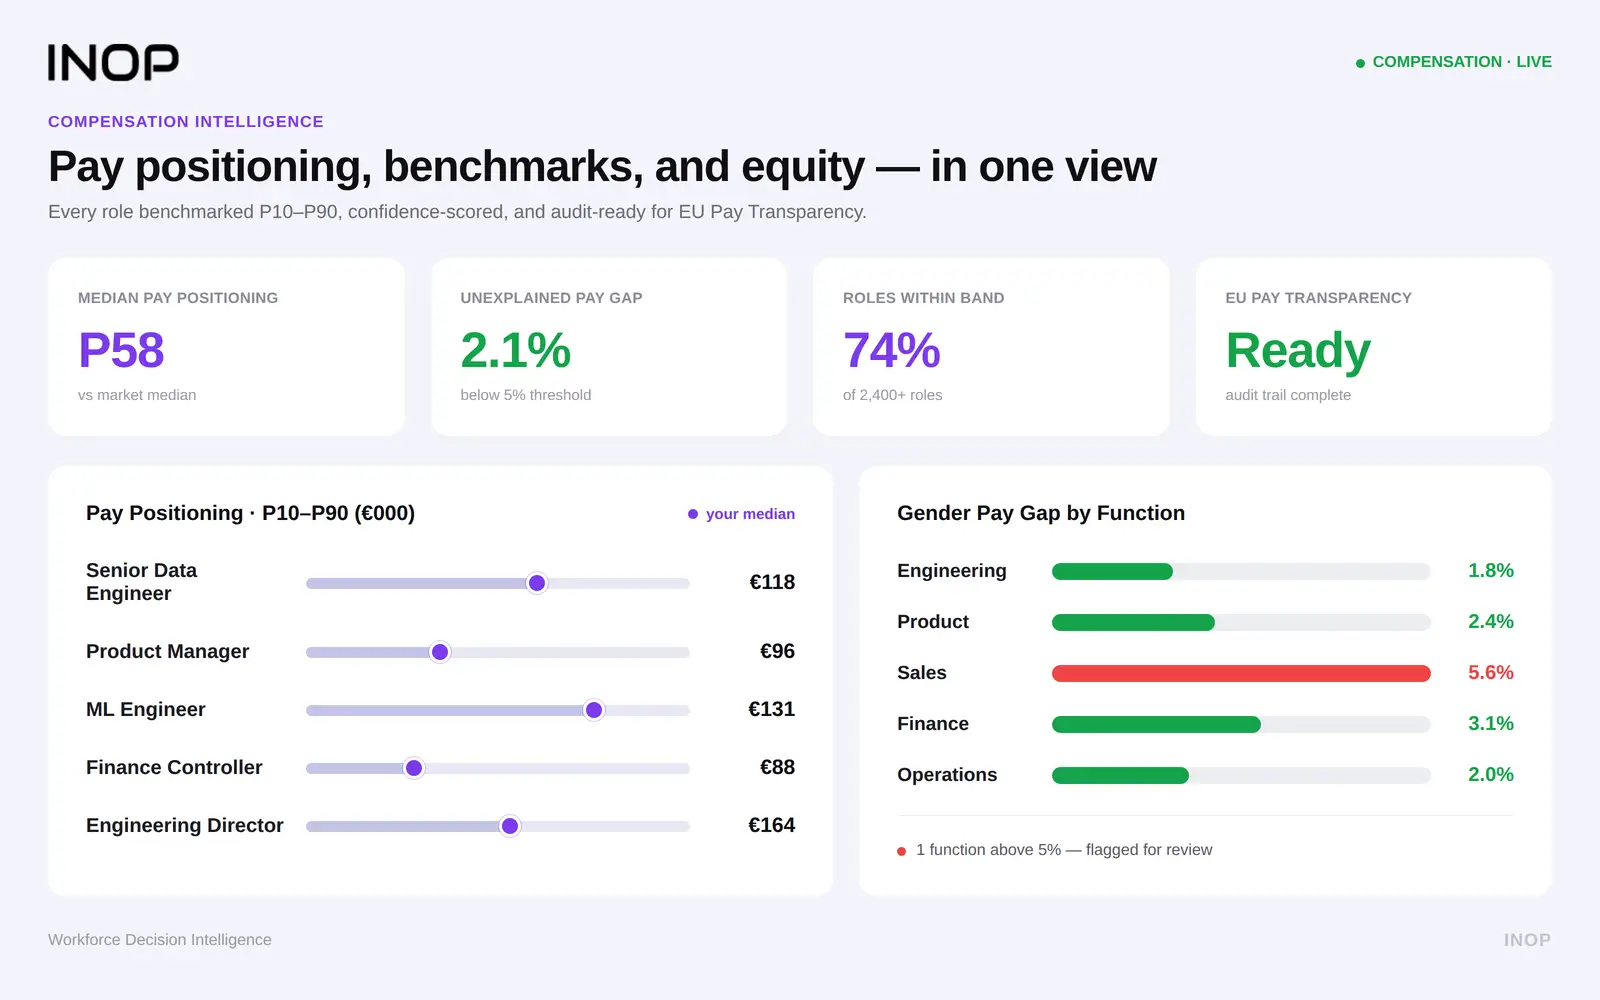
Compensation data at the individual level with external market benchmarking is required for flight risk modeling. Compensation relative to market is one of the strongest predictors of voluntary departure, and it is invisible to models that only have internal pay grades without the market comparison.
Skills or competency assessment data at the individual level, for the roles most critical to strategic execution. Title and tenure are weak proxies for capability. Two employees with the same job title and four years of tenure can have completely different capability profiles, and a model that cannot distinguish them will produce coarse forecasts that managers discount because the outputs do not match what they observe in their teams.
Performance rating history at the individual level, over at least three review cycles. Single-point performance data produces noise. Three or more cycles produce the trajectory signal that makes performance prediction meaningful.
Engagement survey data mapped to individual employees rather than only to aggregate team or department levels. Team-level engagement data is useful for operational management. Individual-level engagement trajectory data is what feeds attrition prediction models with the disengagement signals that precede departure decisions by 60 to 90 days.
Organizations that run this audit first and find gaps invest in data engineering before platform selection. That sequencing produces analytics that Finance trusts within 90 days of launch. Organizations that skip it invest in platforms and then spend 12 months fighting data quality problems while the initiative loses organizational credibility. For more on how skills data quality affects workforce planning decisions, INOP’s guide on skill gap analysis examples covers the assessment methodology that produces individual-level capability data reliable enough to model from.
The Analytics Maturity Model: Four Stages
Workforce analytics tools serve different purposes at different stages of organizational maturity. Buying a predictive analytics platform when your organization has not yet established data trust at the descriptive level is a reliable path to a failed implementation. Understanding where you are determines which tool category is the right next investment.
Stage 1: Descriptive Analytics
Descriptive tools answer: what happened? They summarize historical workforce data — headcount by function, turnover rates, tenure distributions, absenteeism patterns, and simple cohort analyses. This is the foundation that all downstream analytical work depends on, and it requires establishing data trust before anything else is attempted.
Organizations at this stage typically use HR dashboards built inside SAP SuccessFactors, Oracle HCM, or Workday, or they build visualization layers on top of HRIS exports using Tableau or Power BI. The primary diagnostic challenge is not the tool — it is identifying whether the data feeding the dashboard is clean enough to base decisions on.
Stage 2: Diagnostic Analytics
Diagnostic tools answer: why did it happen? They investigate causes using correlation analysis, regression, and cohort joins across variables like manager tenure, pay grade, hire source, and engagement score. When turnover spikes in a specific business unit, diagnostic analysis identifies whether the driver is compensation compression, a specific manager, workload concentration, or skill-to-role mismatch. Each of these requires a different intervention, and a blended turnover metric without diagnostic decomposition produces generic responses to specific structural problems.
Stage 3: Predictive Analytics
Predictive tools answer: what will likely happen next? They use statistical models and machine learning to forecast future events: flight risk scores, hiring demand projections, skill shortage timelines, succession readiness gaps, and engagement trajectory declines. This is where the planning advantage is generated — the 60 to 90 day lead time before an attrition event, the 12 to 18 month lead time before a capability gap constrains execution.
Stage 4: Prescriptive Analytics
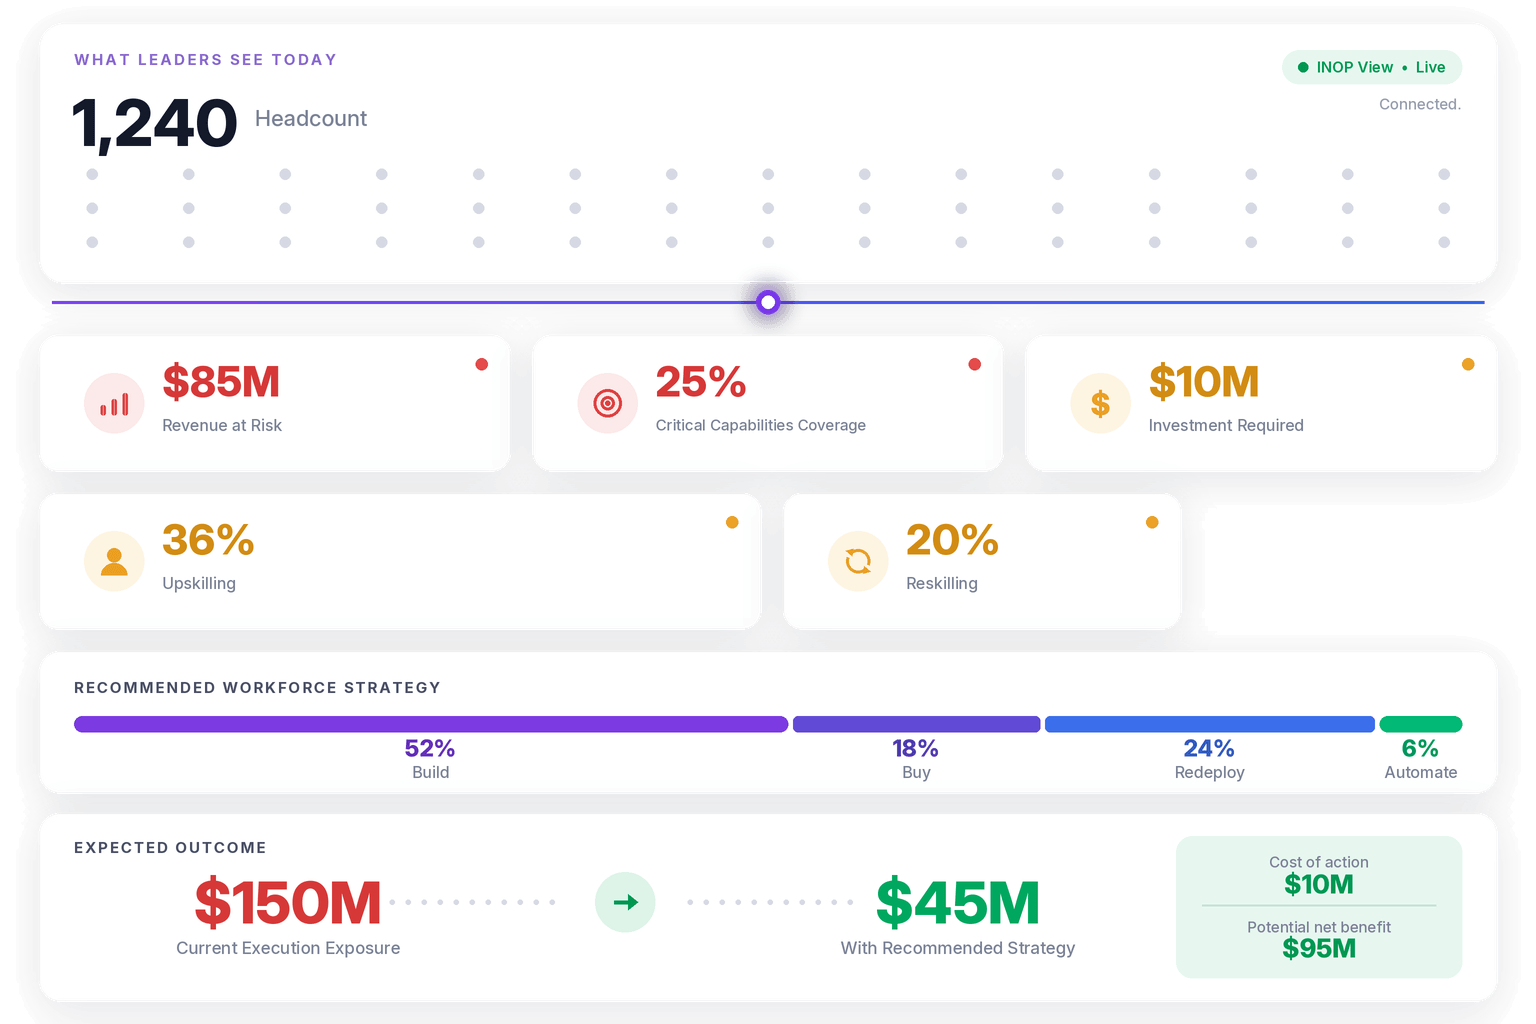
Prescriptive tools answer: what should we do about it? They evaluate multiple intervention options, model the likely effect of each, and recommend the optimal course of action with financial implications attached to each pathway. For workforce planning purposes, this is the BBRA decision layer: given the identified gap, what does it cost to Build capability internally, Buy it externally, Redeploy internal talent with adjacent skills, or Automate the task and remove the human dependency entirely? INOP’s strategic workforce planning platform operates at this layer, connecting predictive gap identification to financial scenario modeling across all four pathways.
The Five Predictive Model Types: What Each One Addresses
Most workforce analytics discussions treat “predictive analytics” as a single capability. In practice, five distinct model families address different future-state planning questions. Knowing which model type addresses your specific problem determines which platforms to evaluate and which data to prioritize.
Model Type 1: Attrition and Flight Risk
These models analyze tenure, absenteeism, engagement score trajectory, compensation percentile relative to external market, manager change recency, and promotion wait time to assign each employee a flight risk probability over a defined time horizon. The output is a ranked list of at-risk employees, with the specific factors driving each individual’s score.
The variable that most organizations underweight in these models is compensation relative to market, not internal pay grade. An employee paid at the 45th percentile of market for their specific skill profile is at materially different attrition risk from one at the 70th percentile, even when both appear in the same internal salary band. Models that use only internal compensation data systematically miss this signal.
Model Type 2: Skills Demand and Performance
These models connect learning data, training programmes, and performance metrics to future role requirements. They identify which training pathways correlate with higher performance and lower attrition in specific role types, and they forecast which capabilities the organization will need at different points in its strategic plan.
For L&D budget allocation, these models change the decision logic from “which programmes have the highest enrollment?” to “which programmes produce the highest-confidence capability outcomes for the roles our strategy depends on most?” The difference in L&D efficiency between those two allocation logics typically runs 30% to 40% improvement in capability outcome per dollar spent.
Model Type 3: Internal Mobility Prediction
These models match employees to roles where their skills, engagement level, and career preferences align with current organizational needs. They surface internal candidates for open roles before external posting becomes the default, and they identify which employees are at elevated attrition risk specifically because their current role underutilizes their assessed capability.
The model’s practical output is a shortlist of internal candidates for each open position, ranked by skills proximity to the role requirements and weighted by the probability that the employee would accept an internal move. Organizations with mature internal mobility models report 40% or higher internal fill rates for roles previously filled exclusively through external search, with corresponding savings in recruitment cost and time-to-full-productivity. For more on how internal mobility connects to talent visibility, INOP’s guide on spotting hidden talent inside your organization covers the identification methodology.
Model Type 4: Cost and Time-to-Fill
These models connect recruiting data, sourcing channels, and assessment results to predict hiring cost and time-to-productivity for each role family and location. They feed the financial dimension of workforce planning decisions: when evaluating whether to build capability internally or hire externally for a specific gap, the time-to-fill model provides the buy-side cost estimate that makes the BBRA comparison financially grounded rather than estimated.
The most analytically useful version of this model segments time-to-fill from time-to-skill. Time-to-fill measures hiring speed. Time-to-skill measures how long it takes a hire to reach full productivity in the role. These two metrics diverge significantly for roles requiring deep technical expertise or strong institutional knowledge, and confusing them produces headcount plans that look fully staffed on paper while the team is still operating below capacity six months after the hire.
Model Type 5: Engagement Trajectory
These models use survey response patterns, absenteeism trends, collaboration signals, and performance trajectory data to identify teams where engagement will likely decline before it registers in standard metrics or becomes visible in turnover. An employee whose engagement scores have dropped in three consecutive surveys, who has requested five sick days in the past month after a period of zero absenteeism, and whose performance rating has declined one level is displaying a pattern that predicts departure in 60 to 90 days, even when their current score still sits above the threshold that would trigger a manual flag.
Engagement trajectory modeling is the model type with the longest intervention lead time and the lowest per-employee intervention cost, because addressing the root cause of disengagement before a resignation decision is made is cheaper at every cost category than replacing the employee after they leave.
Skills Decay Modeling: The Dimension Most Workforce Plans Miss
A skills inventory is a snapshot. The supply forecasts built on it are only as reliable as the snapshot is current, and in fast-moving skill domains the snapshot is already deteriorating the day it is produced.
AI and machine learning capabilities assessed as intermediate against the 2023 framework may be foundational against the 2026 framework because the tooling, the frameworks, and the production standards have all advanced. A cloud architecture certification has an 18 to 24 month shelf life before platform updates render portions of it stale. A financial modeling skill set built on a now-legacy system is technically held by the employee but not deployable for the organization’s current requirements.
Skills decay modeling incorporates depreciation rates into the supply-side workforce forecast. Rather than assuming that an employee assessed as advanced in a skill today will hold the same proficiency level in 18 months without additional development, the model applies a domain-specific decay rate that progressively discounts the supply estimate. Fast-decaying domains like AI development, cloud infrastructure, and cybersecurity need quarterly decay calibration. Stable domains like financial accounting principles or employment law can be modeled on a two to three year decay curve.
The planning implication is direct: organizations that ignore skill decay systematically underestimate their external hiring requirement, because they overestimate how much usable capability their existing workforce will hold at the point when the strategic plan needs it. A workforce plan that says “we have 12 cloud architects today, so we will have sufficient supply for the migration in 18 months” is wrong if four of those 12 have not worked in a production cloud environment in 14 months and their effective proficiency has already decayed below the required standard.
INOP’s skills intelligence platform tracks external demand signal states across four categories, Emerging, In Demand, Stable, and Declining, providing the market-side calibration that makes internal decay modeling externally referenced rather than based on internal assumptions alone.
Analytics Platforms by Organizational Tier: A 2026 Comparison
No single platform covers every workforce modeling use case equally well. The right starting point depends on organizational size, data maturity, and the primary problem you are trying to solve.
Enterprise Platforms (1,000-plus employees)
HRIS-native analytics modules from Workday, SAP SuccessFactors, and Oracle HCM provide embedded workforce analytics within the core HR system. The integration advantage is real: data flows directly from the HRIS without a separate extraction and loading process. The depth limitation is also real: these modules handle descriptive and basic diagnostic use cases well, but complex multi-variable predictive modeling typically requires a dedicated analytics layer on top.
Dedicated enterprise analytics platforms handle this layer. Visier is the market leader for attrition prediction, skills analytics, and workforce planning visualization, and it integrates across multiple HRIS sources rather than requiring a single-system data environment. One Model provides highly customizable analytics infrastructure for organizations that need to build models specific to their own operating context rather than deploying pre-built use cases. IBM Planning Analytics (Workforce) connects workforce modeling to financial planning within the IBM ecosystem, suited for organizations that need HR and Finance to run from shared planning assumptions.
Mid-Market Platforms (200 to 1,000 employees)
ChartHop provides visual organizational analytics with strong headcount planning features and an interface that HR generalists can navigate without data science support. Crunchr offers workforce analytics designed for the same audience, with pre-built use cases for attrition risk, diversity metrics, and organizational health monitoring. Orgvue specializes in organizational design and workforce planning scenario modeling, particularly strong for restructuring situations and M&A integration planning where the org structure itself is the variable being modeled.
Lattice and Leapsome integrate analytics with performance and engagement management, making them appropriate for organizations that want capability and engagement data connected in a single system without a separate analytics layer. HiBob and BambooHR offer HRIS-native reporting with lighter implementation requirements than enterprise platforms, suitable as a starting point for organizations at descriptive analytics maturity building toward diagnostic capability.
Specialist Platforms
Eightfold AI uses deep learning to build talent intelligence graphs from resume data, project histories, and skills assessments. Its skills adjacency modeling identifies which employees are closest to a required capability even when they have not yet demonstrated it explicitly, which makes it particularly valuable for internal mobility and reskilling programme targeting.
Fuel50 focuses on career pathing and internal mobility connected to skills data, suited for organizations where internal mobility is the primary use case and learning pathway design is the primary development mechanism.
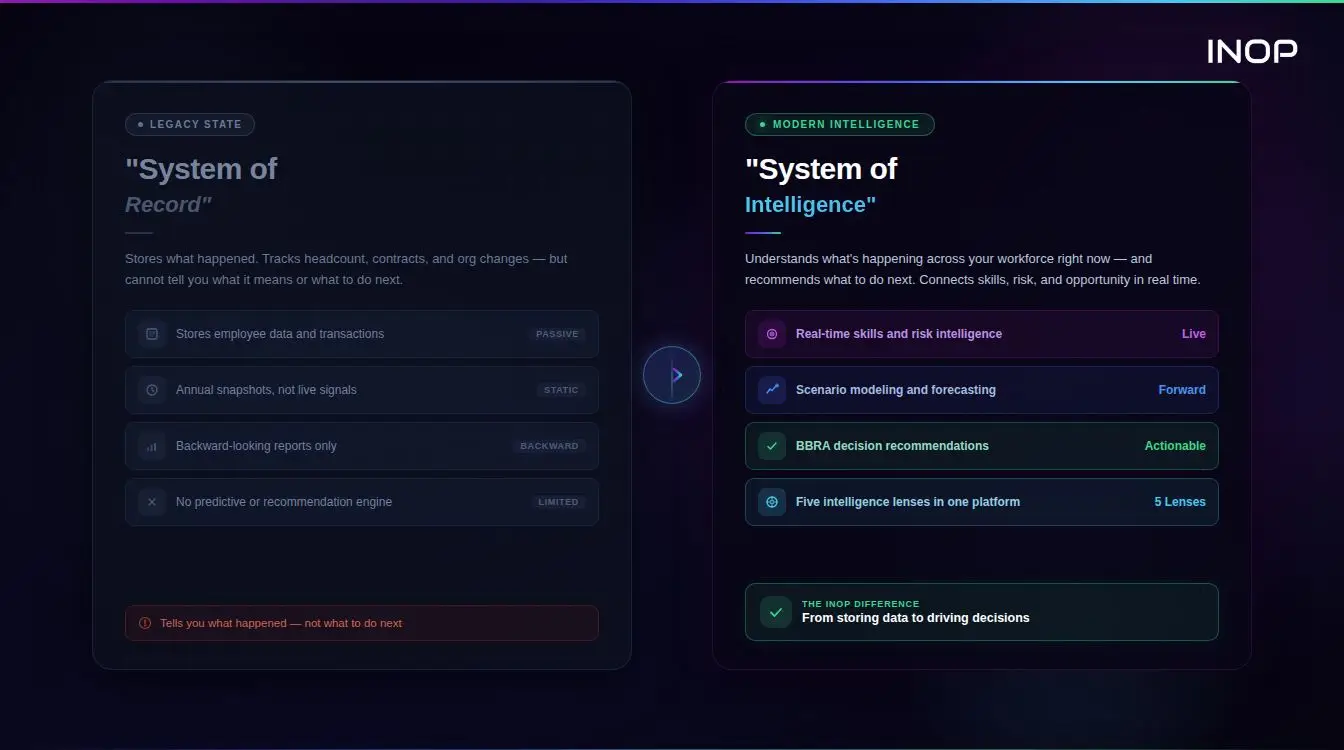
INOP’s workforce planning platform sits in this category with a specific focus on connecting skills gap data to financial scenario modeling across the BBRA decision framework. The distinction from pure analytics platforms is that INOP connects the forecast to the capital allocation decision: a skills gap is not reported as a metric but evaluated across Build, Buy, Redeploy, and Automate pathways, each with a modeled cost, timeline, and risk profile that Finance can evaluate alongside operational investment decisions. For a full comparison of the skills intelligence and planning platform landscape, INOP’s guide on skills-based workforce planning tools covers the full category.
Platform Selection by Primary Use Case
| Primary Use Case | Recommended Starting Point |
|---|---|
| Already on Workday or SAP, need embedded analytics | Native HRIS analytics module |
| Mature analytics function, multiple data sources, complex modeling | Visier or One Model |
| Mid-market, building analytics capability without a data science team | ChartHop, Orgvue, or Crunchr |
| Performance and engagement connected to workforce analytics | Lattice or Leapsome |
| Skills intelligence connected to financial planning decisions | INOP |
| Internal mobility and career pathing as the primary use case | Fuel50 or Eightfold AI |
Key Considerations When Choosing a Workforce Analytics Tool
Before contracting with any platform, get specific answers to these six questions. Vague vendor commitments on these dimensions are a reliable predictor of implementation problems.
Data integration depth. Does the platform connect natively to your HRIS, performance system, compensation data, and LMS through APIs that update continuously, or through CSV imports that require manual intervention? Platforms that depend on manual data exports are only as current as the last export, which means your workforce model is always running on historical data rather than the current state.
Explainability of model outputs. When a predictive model flags an employee as high attrition risk, can the platform show which specific variables drove that score in terms an HRBP can explain to a manager? “Your model says this person is high risk” is not actionable. “Your model says this person is high risk because their compensation is at the 38th market percentile, they received no promotion in 28 months, and their engagement score has declined in three consecutive surveys” is. As AI employment regulations expand in 2026, explainability is also increasingly a compliance requirement for platforms used in employment decisions. For a full treatment of AI governance requirements in HR analytics, INOP’s guide on AI automation bias in workforce decisions covers the legal landscape.
Skills modeling depth. Does the platform distinguish between skill proficiency levels within a skill category, or does it track only skill presence or absence? A platform that records “Python: yes” is less useful for workforce planning than one that records “Python: intermediate, last validated Q2 2025, market demand signal: Emerging.” The granularity of skills data determines the granularity of gap analysis and development pathway recommendations.
Scenario modeling capability. Can the platform run three simultaneous workforce scenarios against different business driver assumptions, or does it produce a single forecast? Single-scenario forecasting breaks whenever the business assumption changes, which is routinely. Platforms that support scenario comparison allow you to adjust the weighting of scenarios when conditions change rather than rebuilding the model from scratch.
Financial integration. Does the platform translate workforce gaps into financial terms — cost to close through each available pathway, financial exposure of leaving the gap open, ROI of each intervention option — or does it produce HR metrics that Finance does not recognize as inputs to budget decisions? The workforce analytics platforms that earn sustained organizational investment are those that produce outputs the CFO uses in quarterly reviews, not reports that stay in the HR inbox.
Implementation timeline to trusted outputs. Ask the vendor to show you a reference customer of similar size and data maturity who reached trusted, decision-grade analytics within 90 days. If they cannot produce a reference, the implementation timeline is longer than their sales materials suggest, and your organization will spend the first 12 months on data cleaning rather than planning.
Workforce Modeling in Practice: Two Industry Examples
Manufacturing: Predicting a Skilled Trades Retirement Wave
A mid-sized manufacturer runs a survival analysis model on its 180-person skilled trades workforce. The model identifies that 31% of electricians and machinists are likely to retire within four years, concentrated in two facilities. Cross-referencing this against the internal skills inventory reveals that fewer than 15% of employees under 35 hold the qualifications to fill those roles at the required standard.
The prescriptive layer evaluates three closure options. Partnering with two regional trade schools to build a four-year apprenticeship pipeline costs $340,000 in programme investment and produces 22 qualified technicians at programme completion. Cross-training 40 existing employees through an 18-month certification programme costs $180,000 and produces 28 qualified technicians, with lower attrition risk because those employees have existing institutional knowledge. External hiring at current market rates for these specializations would cost $4.2 million over four years in search fees, premium wages, and extended ramp time for external candidates unfamiliar with the proprietary equipment.
The model produces the financial comparison that makes the decision a capital allocation choice rather than an HR programme recommendation. The manufacturer invests in both internal options and avoids the external hiring scenario entirely.
Technology: Identifying AI Skill Gaps Before a Product Launch
A 400-person software company is six months out from launching a product that requires generative AI integration across its platform. An internal skills assessment reveals that 11 engineers hold relevant GenAI skills at intermediate or above. The product requires 28. The gap is 17.
The time-to-fill model estimates that external hiring for these roles at current market rates would take 5.4 months per hire in a competitive market, well beyond the six-month window. The skills adjacency model identifies 23 engineers with strong Python and machine learning foundations who could reach intermediate GenAI proficiency within three months of structured development. The build pathway, targeting those 23 with an intensive internal programme, closes the gap within the timeline and at 40% of the external hiring cost.
Without the analytics layer, the company would likely have discovered the gap at month four when the product team escalated. With it, the gap closes on schedule and the product launches without delay.
How Analytics Tools Support Skills-Based Workforce Planning
Traditional workforce planning counts seats. Skills-based workforce planning counts capabilities. Analytics tools are what make the transition from one to the other operationally sustainable at scale.
A skills-based approach asks different questions: not “how many data analysts do we need?” but “how many data analysts with SQL at advanced level, Python at intermediate, and business storytelling at intermediate do we need, and how many of those exist internally today at that specific proficiency combination?” The analytics tool is what makes that question answerable rather than theoretical.
For organizations in healthcare, financial services, and technology, where role requirements are evolving faster than annual skills assessments can track, skills-based analytics tools that continuously update skills profiles through multiple data sources, learning completions, project assignments, and manager validations produce a live capability inventory rather than a periodic snapshot. That live inventory is what enables the internal mobility and redeployment decisions that reduce external hiring dependency and accelerate the organization’s response when strategic priorities shift.
INOP’s skills intelligence platform connects this live skills inventory to external market demand signals across four states, Emerging, In Demand, Stable, and Declining, and to AI automation risk modeling across six dimensions. The result is a workforce capability view that is calibrated to where the market is going, not just where the organization is today. For a detailed treatment of how modern workforce forecasting connects analytics to planning decisions, INOP’s guide on predictive workforce forecasting covers the full methodology.
Analytics Tools for Workforce Modeling in PE Portfolio Companies
Private equity operating partners need workforce analytics outputs in a different format and on a different timeline from enterprise HR teams. The analytics need to be available within 90 days of acquisition, not 12 months into a platform implementation. The outputs need to be expressed in financial terms that an investment committee can evaluate, not HR metrics that Finance translates separately. And the reporting needs to be auditable for the human capital due diligence workstream that institutional buyers conduct as part of the acquisition process.
The three analytics use cases that generate the most value in PE portfolio contexts are: flight risk modeling for the management team and critical individual contributors, where departure during the integration period creates execution risk that the value creation plan did not price in; capability gap analysis against the value creation plan’s specific milestone requirements, not against generic role descriptions; and compensation competitiveness monitoring that identifies which roles are below market in ways that predict attrition before the next benchmarking cycle surfaces the gap.
The financial quantification of each finding is what converts an HR analytics output into a PE-relevant decision input. A flight risk model that identifies three management-level employees each carrying $250,000 in average replacement cost, with an intervention cost of $120,000 in retention bonuses and compensation adjustments, produces a documented 525% ROI on the retention investment. That is the format a quarterly business review uses, not an HR dashboard metric.
INOP’s strategic workforce planning platform delivers rapid capability baseline assessment for portfolio companies connected to financial scenario modeling across the BBRA decision framework, in a format that operating partners and investment committees can use directly for capital allocation decisions. Book a demo to see how INOP approaches workforce analytics in PE portfolio environments.
Ready to connect workforce analytics to financial decisions that Finance will trust? See INOP’s workforce intelligence platform in a 20-minute demo.
Frequently Asked Questions
What analytics tools help model future workforce requirements?
The tools that most reliably model future workforce requirements fall into four tiers based on organizational size and analytics maturity. Enterprise organizations already on Workday or SAP should start with native HRIS analytics modules before adding dedicated platforms like Visier or One Model. Mid-market organizations benefit from purpose-built planning platforms like ChartHop, Orgvue, or Crunchr, which are designed for HR teams without dedicated data science support. Organizations whose primary need is connecting skills intelligence to strategic planning and financial decision-making should evaluate workforce decision intelligence platforms like INOP. The right tool for your organization depends on your data quality, your primary use case, and whether you need workforce analytics that informs HR decisions or workforce intelligence that informs capital allocation decisions.
What data is required before implementing a workforce analytics platform?
The minimum dataset for reliable workforce modeling includes: current headcount with complete organizational structure updated monthly; rolling 12-month attrition segmented by role family and tenure band rather than blended across the organization; individual-level compensation data with external market benchmarking; skills or competency assessment data for strategically critical roles; individual-level performance ratings over at least three review cycles; and engagement survey data mapped to individual employees. Organizations that skip this data audit and implement platforms on incomplete data consistently find their analytics outputs are not trusted by Finance, which undermines the investment and stalls organizational analytics maturity development.
What is the difference between descriptive, predictive, and prescriptive workforce analytics?
Descriptive analytics answers: what happened? It summarizes historical data — headcount, turnover rates, tenure distributions. Predictive analytics answers: what will likely happen? It uses statistical models to forecast attrition risk, skills shortages, and hiring demand 60 to 18 months in advance. Prescriptive analytics answers: what should we do about it? It evaluates multiple intervention options, models the financial impact of each, and recommends the optimal course of action. Most organizations have descriptive capability. Fewer than a third have reliable predictive capability, according to AIHR’s 2026 analytics maturity research. Prescriptive capability requires a solid predictive foundation plus the decision architecture to translate forecasts into capital allocation recommendations.
How does skills decay affect workforce modeling accuracy?
Skills decay is the depreciation of assessed proficiency over time in domains where the technology, frameworks, or market standards evolve. AI development, cloud infrastructure, and cybersecurity skills assessed as intermediate today may be effectively foundational in 18 months without additional development. Workforce models that treat skills as static assets systematically overestimate future internal capability supply, which produces optimistic gap estimates that turn into execution surprises. Incorporating domain-specific decay rates into supply modeling produces more conservative and more accurate forecasts: fast-decaying domains like AI development need quarterly decay calibration, while stable domains like financial accounting principles can be modeled on a two to three year decay curve.
What role does AI play in workforce requirement modeling in 2026?
AI contributes to workforce modeling in three ways that were not reliably available before 2024. First, skills inference: AI tools can infer employee skill profiles from work activity, project assignments, and collaboration patterns, reducing the data collection burden for organizations building their skills inventory from scratch. Second, scenario simulation: AI enables rapid comparison of many simultaneous planning scenarios, surfacing the optimal staffing configuration under different business assumptions faster than manual modeling allows. Third, automation impact modeling: AI can assess which tasks within each role face automation probability across defined time horizons, informing the Automate pathway in BBRA gap closure analysis. McKinsey’s 2025 research found 28% of routine knowledge tasks are now automatable, and workforce planning platforms that do not model this dimension systematically overestimate human headcount requirements.
How do you calculate ROI from workforce analytics investment?
ROI from workforce analytics investment is most defensible when built from three avoided-cost categories. Avoided attrition replacement cost: take the number of at-risk employees the model identifies, multiply by your intervention retention rate, and multiply by average replacement cost for each role. Reactive hiring premium reduction: organizations with proactive workforce demand forecasts fill roles from planned pipelines rather than emergency requisitions, avoiding the 19% to 30% premium that reactive hiring commands in agency fees and compressed search timelines. Project delay avoidance: the cost of a strategic initiative delayed because the required capability was not available when needed often exceeds the entire annual analytics platform investment in a single incident. Present these three calculations to Finance before the tool selection conversation, and the investment decision becomes a return-on-capital evaluation rather than a budget request.
Can mid-market companies benefit from workforce analytics tools?
Yes. The 2026 platform landscape now includes mid-market-specific tools that require no dedicated data science team to operate. ChartHop, Crunchr, and Orgvue are designed specifically for HR leaders who need actionable workforce insights without building an analytics infrastructure. The entry point for meaningful workforce modeling has also dropped: a well-maintained HRIS with accurate role, tenure, and attrition data, analyzed through a purpose-built mid-market platform, can produce attrition risk scoring, skills gap identification, and basic scenario modeling within 60 to 90 days of implementation. The principle that applies at every scale is the same: start with one high-value use case, establish trusted outputs, demonstrate financial impact, then expand scope from that demonstrated base.
What is the difference between people analytics and workforce analytics?
People analytics typically refers to analysis at the individual employee level: performance patterns, engagement trajectories, attrition risk scores for specific employees. Workforce analytics operates at the aggregate organizational level: headcount trends, capability supply versus demand, scenario modeling for future workforce configurations, and cost modeling for different gap closure pathways. In practice, the best platforms do both, using individual-level data to produce organizational-level planning insights. The distinction matters when evaluating tools: platforms optimized for individual-level people analytics may not have the scenario modeling and supply-demand forecasting capabilities required for strategic workforce planning at the board reporting level.