Most organizations know they have skill gaps. Far fewer know what those gaps are actually costing them. If your board is asking for a business case to invest in workforce capability development, or your CFO wants to understand why productivity is slipping despite full headcount, the answer almost always traces back to one thing: unmeasured skill gaps hiding inside your talent base. Effective skills mapping is the foundation of that measurement, and without it, you are making multi-million-dollar workforce decisions without the data to back them up.
This article is a practical guide for CHROs and senior HR leaders who need to move beyond identifying skill gaps and start putting credible financial figures behind them. We will cover the real cost categories, the formulas and frameworks that make the numbers defensible at board level, and the structured approach that connects capability data to business outcomes. Platforms like INOP are purpose-built for exactly this challenge, connecting skills intelligence directly to financial and strategic planning decisions.
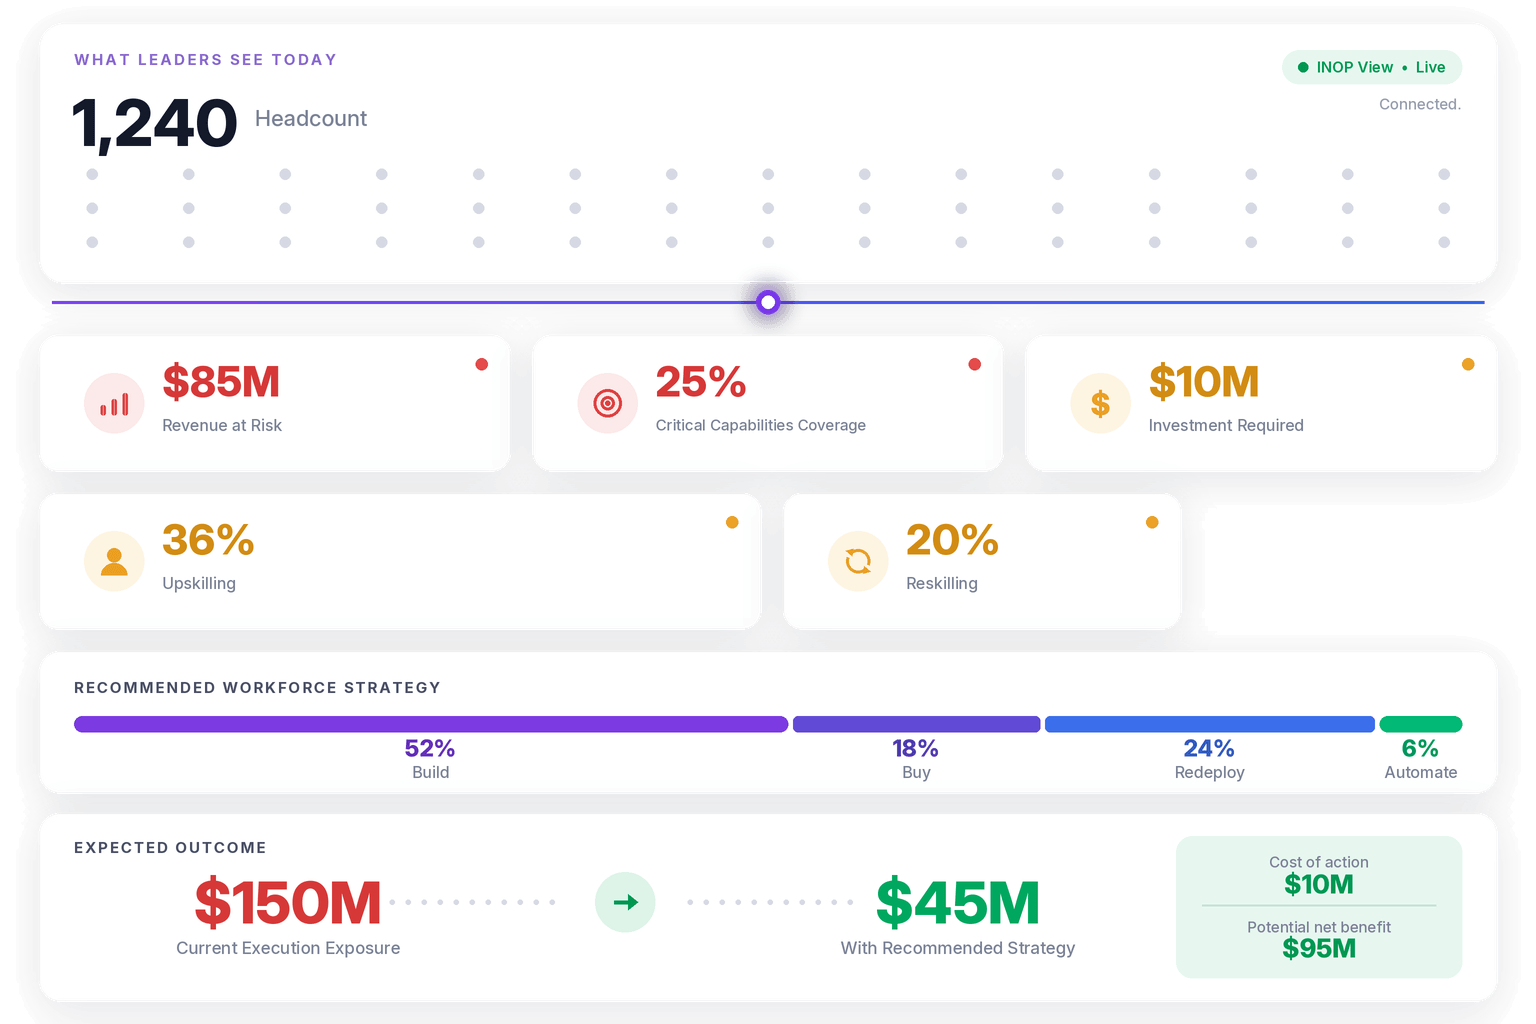
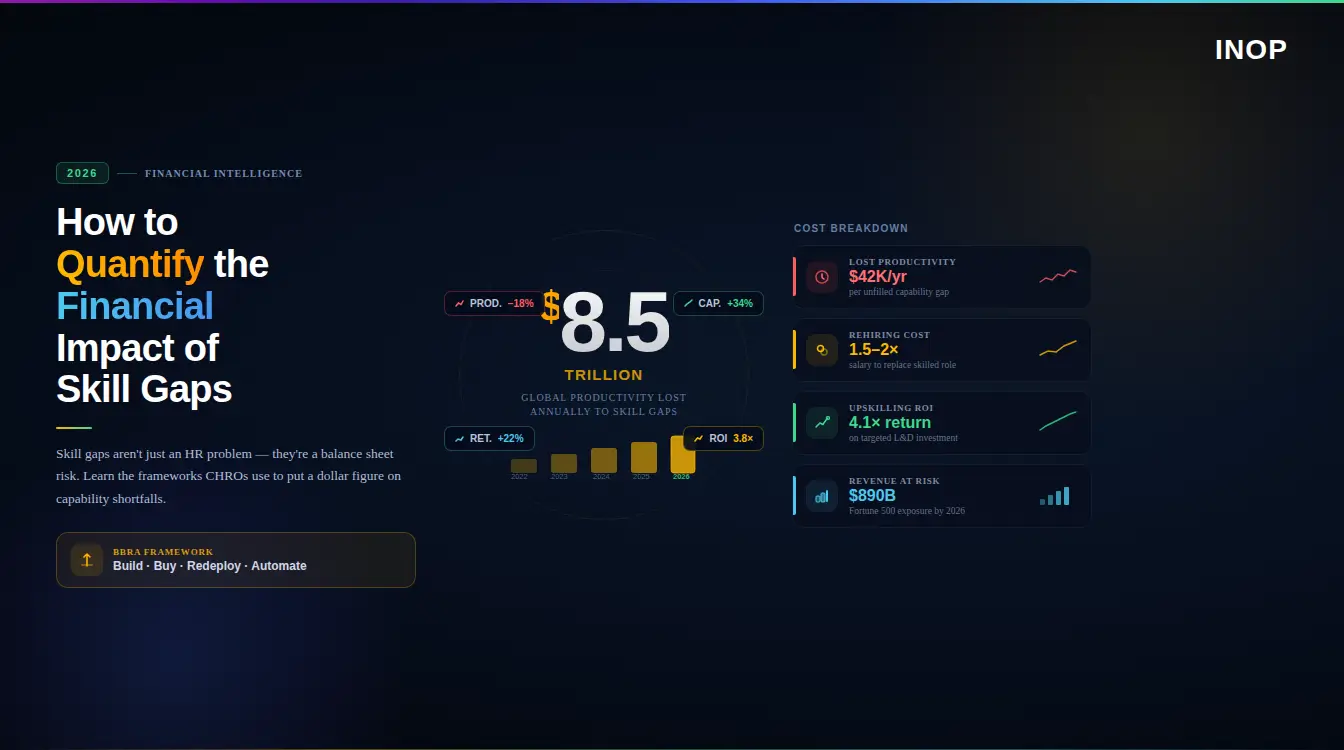
This format works at board level because it connects workforce data to line-item financial exposure. It transforms a talent conversation into a risk and investment conversation.
Why the Financial Conversation Around Skill Gaps Is Now Unavoidable
The scale of the problem makes inaction increasingly indefensible. According to IDC research based on a survey of 811 enterprise IT leaders, tech talent shortages alone are projected to cost organizations $5.5 trillion by 2026, with losses stemming from product delays, the inability to compete, and loss of business. That is not a talent management statistic. That is a business risk number that belongs in a board-level risk register. Beyond tech, the picture is equally stark. Research cited by TalentGuard shows that skill gaps are currently costing the U.S. economy around $13 billion per month, with Deloitte estimating a total cost of $2.5 trillion over the next decade. And at the organizational level, the average company loses approximately $1.3 million per year directly attributable to skill gaps. For CHROs, the challenge is translating these macro figures into something specific to your organization, your roles, and your strategic priorities. The macro numbers create urgency. Your own internal measurement creates accountability and action. Recent data shows that 87% of companies already face skill shortages or expect them soon, more than two-thirds of employers report that skill shortages are reducing productivity, and 60% say open roles remain unfilled for three months or longer. These are not future-state concerns. They are current operational realities with measurable financial consequences.What Skills Mapping Actually Means in This Context
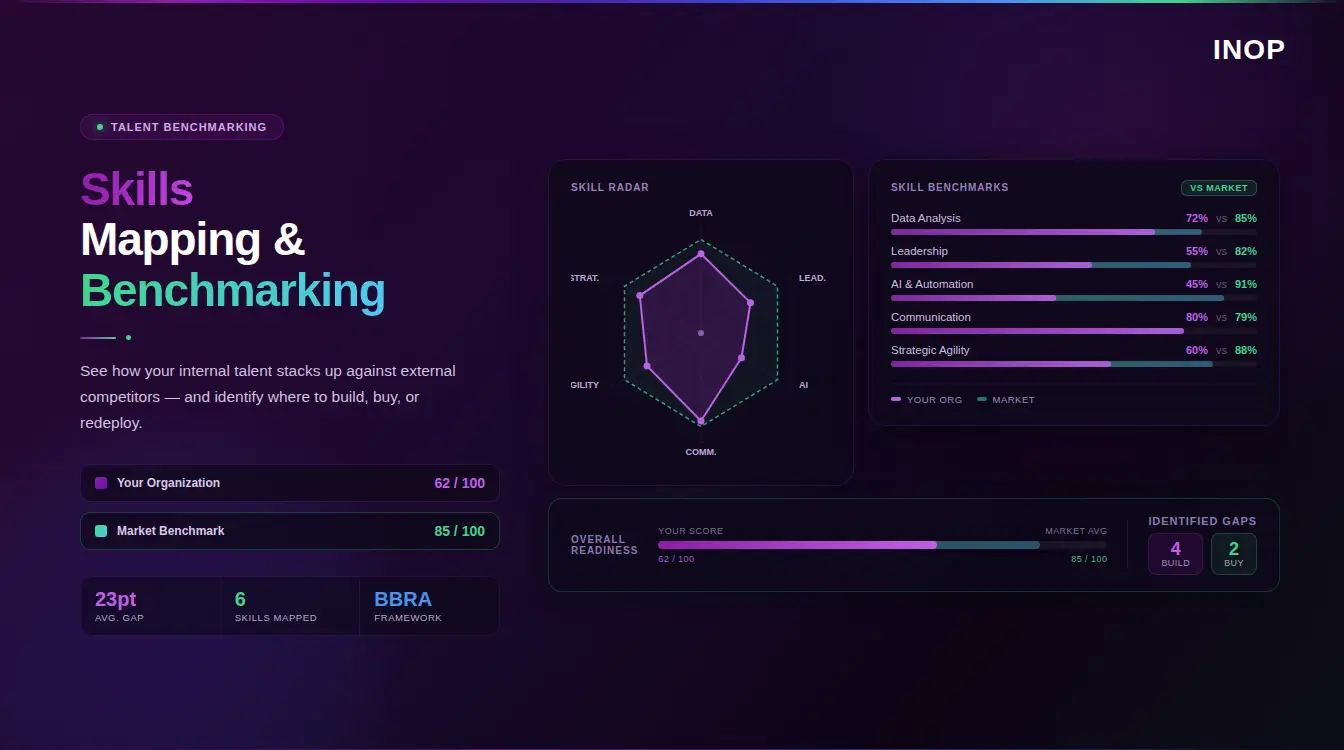
Before you can quantify a financial impact, you need a reliable picture of where skill gaps exist. That is the function of skills mapping. Skills mapping is the process of systematically documenting the skills your workforce currently holds, the proficiency level of each skill across individuals and teams, and the gap between current capability and what your strategy actually requires. It is not a training needs analysis. It is not a performance review exercise. It is a structured inventory of organizational capability that functions as the input data for every subsequent workforce decision. A mature skills map captures three dimensions: what skills exist (breadth), how strong each skill is (depth), and where skills are concentrated or scarce across the organization (distribution). When all three dimensions are available, you can begin to calculate financial exposure in precise terms. Without this foundation, financial quantification becomes guesswork. With it, you can attach a cost figure to every identifiable gap.The Four Cost Categories You Need to Measure
Skill gap costs do not appear on a single line in your P&L. They are distributed across four distinct categories, and each requires a different measurement approach.Direct Productivity Loss
This is the most immediate and calculable cost. When an employee lacks the skill to perform a task at the required proficiency level, output drops. You can estimate this using a straightforward formula: Annual Salary × Productivity Deficit Percentage = Annual Productivity Loss per Employee For example, if a project manager with an annual salary of $90,000 is operating at 70% of expected proficiency in a newly required capability (say, data-driven reporting), the productivity loss is approximately $27,000 per year for that individual alone. Multiply this across a team of ten with similar gaps, and you are looking at $270,000 in unrealized output annually, from a gap that rarely appears on any financial statement. More than two-thirds of employers report that skill shortages are already reducing productivity, and when productivity declines the effects spread quickly across budgets, timelines, and customer expectations.Vacancy and Time-to-Fill Costs
When skills are missing internally and cannot be quickly developed, organizations default to external hiring. The financial exposure here is significant. According to SHRM data, each unfilled position costs companies an average of $4,129 over a 42-day vacancy period, and the cost for revenue-generating roles can reach $7,000 to $10,000 per month depending on the position. For a $100,000 position, each day of vacancy represents roughly $450 in lost productivity. Leave that role unfilled for 45 days, and you are looking at $20,000 in unrealized output before factoring in how the gap affects the rest of the team. The formula for cost of vacancy (COV) is: (Annual Salary ÷ 260 working days) × Revenue Impact Multiplier × Days Vacant = Cost of Vacancy The revenue impact multiplier adjusts for how strategically critical the role is. For a senior product or revenue role, the multiplier may be 2x or 3x. Skills gaps in IT operations, cloud architecture, data management, and software development triggered digital transformation delays of up to 10 months for nearly two-thirds of organizations. That kind of delay is not just a productivity cost. It is a competitive cost that is far harder to recover.Reskilling and Training Investment
This is the cost that organizations most commonly try to measure, but they often undercount it. The full cost of addressing a skill gap through training includes:- Direct learning and development program costs
- Employee time taken off productive work during training
- Productivity ramp time after training before full proficiency is reached
- Manager time spent coaching and supporting the transition
Strategic and Competitive Impact
This fourth category is the hardest to quantify precisely but carries the largest financial consequences. When skill gaps prevent an organization from executing on strategic initiatives, the cost is measured in revenue not generated, market position not captured, and innovation cycles not completed. More than three in five respondents in IDC’s survey said skills gaps triggered product delivery delays and missed revenue goals, with nearly as many reporting quality problems and customer satisfaction shortfalls as a result of talent shortages. If your organization has a strategic initiative projected to generate $5 million in new revenue over two years, and skill gaps in your execution team delay that initiative by six months, the financial impact is not just the delay cost. It is the lost first-mover advantage, the competitor ground gained, and the cost of operating under the capability ceiling imposed by the gap.Building the Financial Case: A Step-by-Step Framework
Here is a practical approach that CHROs can use to quantify and present skill gap costs in financial terms.Conduct a Structured Skills Inventory
Start with skills mapping at the role and team level. Map current proficiency against required proficiency for each critical capability in your strategic plan. Identify:- Roles where proficiency gaps are widest
- Capabilities where gaps are most concentrated across the workforce
- Skills that are critical to near-term strategic execution
Ready to see what skill gaps are actually costing your organization? Book a demo with INOP and discover how to connect your workforce capability data to real financial outcomes.
Assign Financial Values to Each Gap Category
For each identified gap, apply the relevant formula from the four categories above. Build a simple matrix that finance and the board can engage with directly:| Gap Type | Affected Roles | Estimated Annual Cost |
|---|---|---|
| Productivity deficit (existing employees) | 45 project managers | $380,000 |
| Vacancy / time-to-fill (open roles) | 8 data engineering roles | $210,000 |
| Reskilling investment needed | 120 employees | $1,400,000 |
| Strategic initiative delay (1 major project) | Cross-functional | $800,000 |
| Total Estimated Exposure | $2,790,000 |
Apply the BBRA Decision Framework
Once the financial exposure is mapped, the next question is how to close the gaps. This is where the BBRA framework becomes essential. BBRA stands for Build, Buy, Redeploy, and Automate, and it provides a structured decision lens for each identified gap:- Build: Develop the capability internally through reskilling or upskilling programs. Best suited for gaps where adjacent skills exist and time allows.
- Buy: Hire externally to bring in the required capability. Most appropriate when speed is critical and the gap is too wide to bridge through development.
- Redeploy: Identify employees elsewhere in the organization who already hold the required skills and move them to where the gap exists. This is often the fastest and most cost-effective option, but it requires accurate skills mapping to surface those internal candidates.
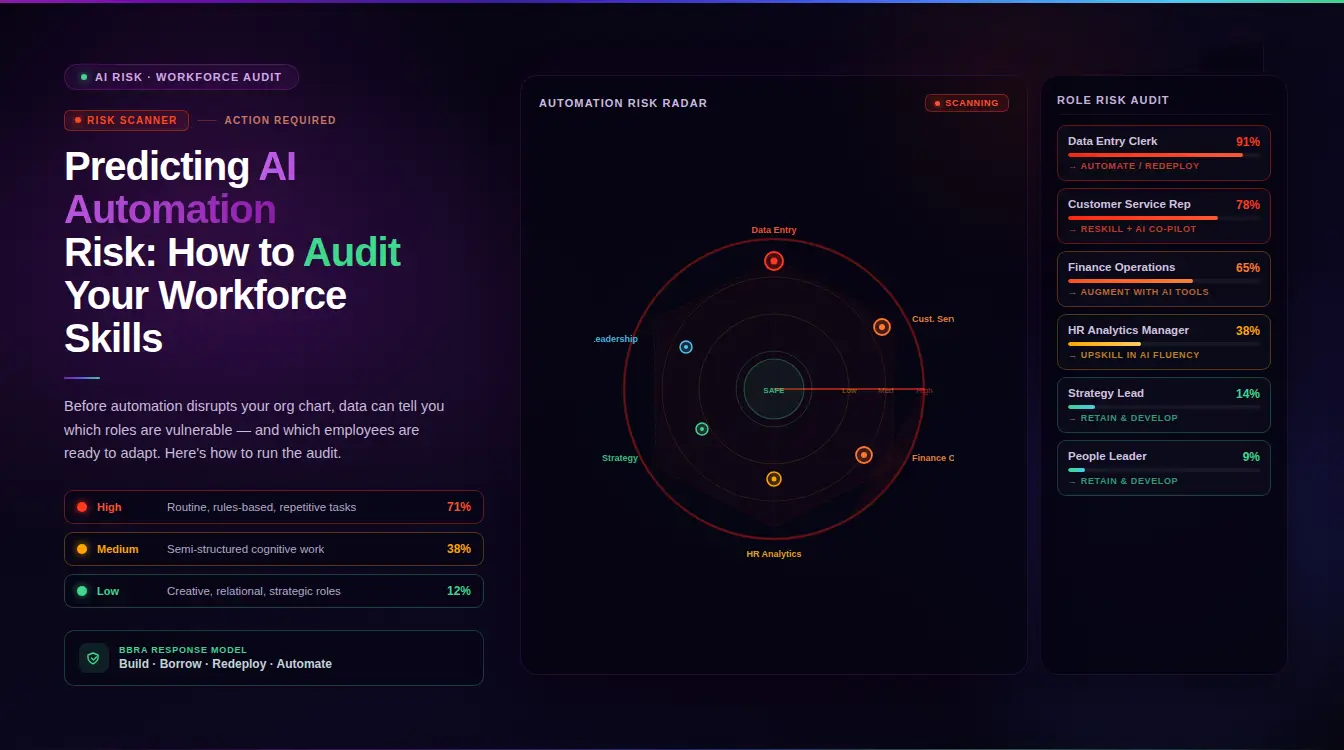
- Automate: Evaluate whether the function can be partially or fully automated, eliminating the need to fill the gap through human capital. This is increasingly relevant in 2026 given the pace of AI capability development.
Want to apply the BBRA framework to your workforce planning decisions? Book a demo with INOP to see how to model Build, Buy, Redeploy, and Automate scenarios with real capability data.
Validate Against External Market Signals
Internal skills data alone is not sufficient for a complete financial picture. You also need to know whether the skills you are trying to build or buy are in growing or declining demand in your market. A gap in a skill that is becoming obsolete carries a different investment calculus than a gap in an emerging capability that every competitor is also trying to acquire. Without an external skills intelligence lens, you cannot see skills that remain prioritized internally while market demand declines, emerging capabilities entering competitor organizations before yours, or whether upskilling investments align with where your sector is moving. INOP maps each skill in your taxonomy against real-time external demand signals, classifying capabilities as emerging, in-demand, stable, or declining. This allows you to weight your financial exposure calculations based on the strategic urgency of each gap, not just its internal visibility.Build the Ongoing Monitoring Cadence
Skill gap costs are not static. Skills decay. Market demands shift. Strategic priorities evolve. A financial quantification exercise done once becomes outdated within a quarter. Strategic workforce planning at the CHRO level requires this to be a continuous process, not an annual event. Set a cadence for:- Quarterly skills inventory refresh for priority capability areas
- Monthly review of vacancy costs for critical open roles
- Semi-annual reassessment of BBRA decisions in light of new skills data and market signals
Common Measurement Pitfalls to Avoid
Even organizations that begin skills mapping and financial quantification often fall into predictable errors. Here are the most costly ones. Measuring only hired positions, not existing employees. Many organizations track the cost of unfilled roles but ignore the productivity deficit created by existing employees with unidentified skill gaps. The financial exposure is equally large, and often larger. Using job titles as a proxy for skills. Two employees with identical job titles can have wildly different skill profiles. Financial calculations based on role-level assumptions significantly undercount actual exposure. Ignoring the compound effect. Skill gaps do not simply cause a linear cost. They cascade. Research by Gallup indicates that employees who frequently work overtime to cover gaps are at a higher risk of burnout, which can decrease productivity by up to 68%, and employees are 2.6 times more likely to leave a job due to burnout. One gap creates workload spillover, which creates burnout, which creates attrition, which creates new gaps. The cost of the original gap is a fraction of the compound total. Treating reskilling as a cost center rather than an investment. Organizations investing in skills-based workforce planning report ROI ranging from 240% to 420% with payback periods under two years. When reskilling is measured as an investment with a projected return, the financial conversation with finance and the board changes entirely.What Good Looks Like: A Benchmark for Financial Maturity
Organizations at different stages of skills mapping maturity have very different abilities to quantify financial impact. Here is a simplified maturity benchmark: Level 1 (Reactive): Skill gaps are identified after they cause problems. No structured skills inventory exists. Financial impact is unmeasured and estimated retrospectively. Level 2 (Descriptive): Basic skills assessments have been conducted. Gap analysis exists at a point in time. Cost of vacancy is tracked for open roles, but productivity deficit among existing employees is not measured. Level 3 (Predictive): Skills inventory is maintained continuously. Gap analysis is connected to strategic planning cycles. Financial exposure across all four cost categories is modeled and reviewed quarterly with finance. Level 4 (Strategic): Skills mapping is integrated with business strategy, financial planning, and scenario modeling. BBRA decisions are made from live capability data. External market signals validate internal priorities. Skills intelligence is a board-level input. Most CHROs reading this are operating at Level 1 or 2. The financial impact of that gap in measurement capability, as this article has demonstrated, runs into millions of dollars annually for a mid-size to large organization.Conclusion
The question is no longer whether skill gaps are costing your organization money. The data is unambiguous on that point. The question is whether your organization has the measurement infrastructure to see those costs clearly enough to act on them. Skills mapping is not an HR exercise. It is a financial risk management discipline. When done well, it surfaces the hidden liabilities inside your existing workforce, enables smarter BBRA decisions, and gives CHROs the data credibility to drive investment decisions at the executive table. The organizations that will win on talent in 2026 and beyond are not the ones that hire the most. They are the ones that see the clearest, act the fastest, and invest in the right capabilities at the right time, guided by continuous, data-informed skills intelligence. If you are ready to move from guesswork to financially defensible workforce planning, explore how INOP’s strategic workforce planning platform connects skills data to business outcomes, or visit INOP’s skills intelligence service to learn more about building a live, market-validated capability view for your organization.Frequently Asked Questions
What is the difference between a skill gap and a skills mapping exercise?
A skill gap is the difference between the capability an employee or team currently holds and what is required for them to perform effectively in their role or contribute to a strategic initiative. Skills mapping is the structured process of documenting current skill levels across your workforce so that you can identify where those gaps exist. Skills mapping is the diagnostic tool. Skill gaps are what it reveals. You cannot reliably quantify financial impact without first conducting a thorough skills mapping exercise.How often should we conduct a skills mapping review?
For most organizations, a comprehensive skills inventory should be refreshed at minimum semi-annually for the full workforce, with quarterly updates for roles and capabilities tied to active strategic priorities. The underlying data, however, should be maintained continuously. Modern skills intelligence platforms automate much of this refresh cycle by pulling from performance data, project history, learning completions, and self-assessments, eliminating the need for periodic manual surveys.Can we use our existing HRIS data to calculate skill gap costs?
Standard HRIS data captures headcount, roles, and tenure, but it rarely captures skill proficiency levels in a way that enables accurate financial modeling. You can use HRIS data as a starting point, for example pulling salary data to calculate productivity loss formulas, but you will need dedicated skills mapping data to identify which employees have which gaps at which proficiency levels. Most CHROs find that integrating a skills intelligence layer on top of existing HRIS infrastructure gives them the capability data they need without replacing their core systems.How do we make the financial case for skills mapping investment to our CFO?
The most effective approach is to start with a single business unit or strategic initiative and model the four cost categories (productivity loss, vacancy costs, reskilling investment, and strategic delay) for identifiable gaps in that scope. Produce a number with a credible methodology behind it. Even a conservative estimate of $1 to $2 million in annual exposure, backed by role-level data, is typically sufficient to justify an investment in skills mapping infrastructure. The CFO conversation changes when skill gaps appear as a financial risk rather than a talent management challenge.What is the BBRA framework and how does it apply to skill gap remediation?
BBRA stands for Build, Buy, Redeploy, and Automate. It is a decision framework for determining the most cost-effective response to each identified skill gap. Build means developing the capability internally. Buy means hiring externally. Redeploy means identifying existing employees with the required skills and moving them to where the gap exists. Automate means evaluating whether the function can be handled through technology, removing the human capital requirement altogether. Applying BBRA systematically requires a current, accurate skills map, because without it the Redeploy option, often the fastest and cheapest, remains invisible to decision-makers.How does external market data improve financial quantification of skill gaps?
Internal skills mapping tells you what your workforce currently holds. External market intelligence tells you whether those capabilities are growing or declining in value in your industry. A gap in a skill with accelerating external demand carries a higher strategic cost than a gap in a skill with stable or declining relevance. Incorporating external demand signals into your gap analysis allows you to weight financial exposure by strategic urgency, directing investment toward the gaps that carry the greatest competitive and financial risk if left unaddressed.What is a reasonable ROI expectation for investing in skills-based workforce planning?
The documented evidence is compelling. Organizations that have implemented structured skills-based workforce planning report ROI ranging from 240% to 420%, with payback periods typically under two years. These returns come from a combination of reduced external hiring costs through improved internal redeployment, lower vacancy costs through faster internal matching, reduced reskilling waste through better targeting of development investment, and improved strategic execution through fewer capability-driven project delays. The exact ROI will vary by organization size, industry, and current maturity level, but the financial case for investment is consistently strong when measured against the documented cost of inaction.Book a Demo
Make confident workforce decisions that support strategy and value creation.