Salary tools are software and data services that show what the market pays for a job, a skill or a location, and how your own pay compares. They include crowdsourced salary sites, survey-based compensation tools, and real-time platforms that connect market data to your HR systems. Most buyers compare salary benchmarking tools by brand, but the better comparison is by data source, update frequency and what the tool lets you decide. This guide shows how to compare salary tools, where each type falls short, and how INOP connects pay data to workforce decisions.
What Are Salary Tools?
A salary tool answers one question: is this pay right? It does so by comparing a job or skill against market data, then showing where your current pay sits. Some tools stop at a number. Better compensation tools show the source of that number, how recent it is, and how well the job match holds.
Salary tools sit between two related things. Salary surveys supply raw market data. Compensation benchmarking is the process of matching your jobs to that data and acting on it. A salary tool packages the data, the matching and the reporting into one product.
Who Should Use Salary Tools?
- CHROs and HR leaders who set pay ranges and defend them to the business.
- CFOs and finance teams who plan the pay budget and need to see the cost of every decision.
- Compensation teams who run annual reviews and pay equity checks.
- Private equity operating partners who compare pay structures across a portfolio.
Types of Salary Tools by Data Source
The data source decides how far you can trust a result. Crowdsourced data is fast and broad but unverified. Survey data is verified but ages between releases. Real-time data is current but depends on clean internal records. Each type has a place, and the best choice depends on the decision you need to make.
Employee-Reported (Crowdsourced) Data
Crowdsourced tools collect pay figures that employees submit. They are quick to use, often free, and cover many job titles and companies. The weaknesses are sample size, self-reporting error and weak job matching. A figure for a niche role may rest on a handful of entries, and a title can hide very different scopes of work.
Traditional Surveys and Consultancy Data
Survey-based tools draw on data that participating employers submit and a provider validates. Data quality is usually higher and job matching is more formal. The trade-offs are cost, annual or semi-annual refresh cycles, and the manual effort needed to match your jobs and apply the results.
Real-Time and HRIS-Integrated Platforms
Real-time platforms connect market data to your HR and finance systems, so benchmarks update as the market and your workforce change. They reduce manual work and can match jobs by skills as well as by title. The trade-off is that results depend on the quality of your internal data, so clean job and pay records come first.
Salary Tool Comparison Matrix
| Criterion | Crowdsourced tools | Survey-based tools | Real-time and integrated platforms (INOP) |
|---|---|---|---|
| Primary data source | Employee-submitted pay | Employer-submitted, provider-validated pay | Live market data combined with your own HR and finance data |
| Update frequency | Continuous, unverified | Annual or semi-annual | Continuous |
| Trust in the figure | Varies with sample size | High for matched jobs | Depends on internal data quality and match method |
| Total rewards view | Often base pay only | Base, bonus and some benefits | Total compensation, linked to skills |
| Manual HR effort | Low to start, high to verify | High (matching and loading data) | Low once data is connected |
| Best for | Quick checks and early research | Formal range setting and audits | Ongoing pay decisions tied to workforce plans |
For a related comparison of spreadsheets against automated tools, read salary tools comparison: spreadsheets vs AI-powered intelligence.
Payscale Alternatives: How to Choose by Data Model
Searches for Payscale alternatives, Salary.com alternatives or other brand comparisons usually mean one of three needs. Match the need to the data model, and the shortlist gets shorter.
- You need lower cost or faster access. Look at crowdsourced and public data, and accept the sample-size limits.
- You need formally validated data for ranges and audits. Look at survey-based providers, and plan for the matching work.
- You need pay data tied to live workforce decisions. Look at integrated platforms that read your HR and finance data and match by skills.
Whatever you compare, ask each vendor the same questions: where does the data come from, how recent is it, how is a job matched, and how do I audit a figure? A tool that cannot answer all four is not ready for a pay decision.
Pay Review Tools: What to Look For
Pay review tools support the annual or mid-year review of pay against budget and market. Salary review tools and compensation review tools cover the same ground. A good one does more than show a market number.
- Range positioning. It shows compa-ratio and range penetration for every employee. AIHR’s worked example uses a salary of $50,000 in a $45,000 to $60,000 range: the compa-ratio is 95 percent while range penetration is 33 percent, so state which metric you show.
- Budget modeling. It lets finance test merit and adjustment budgets before they are approved.
- Approval workflow. It records who proposed, who approved and why.
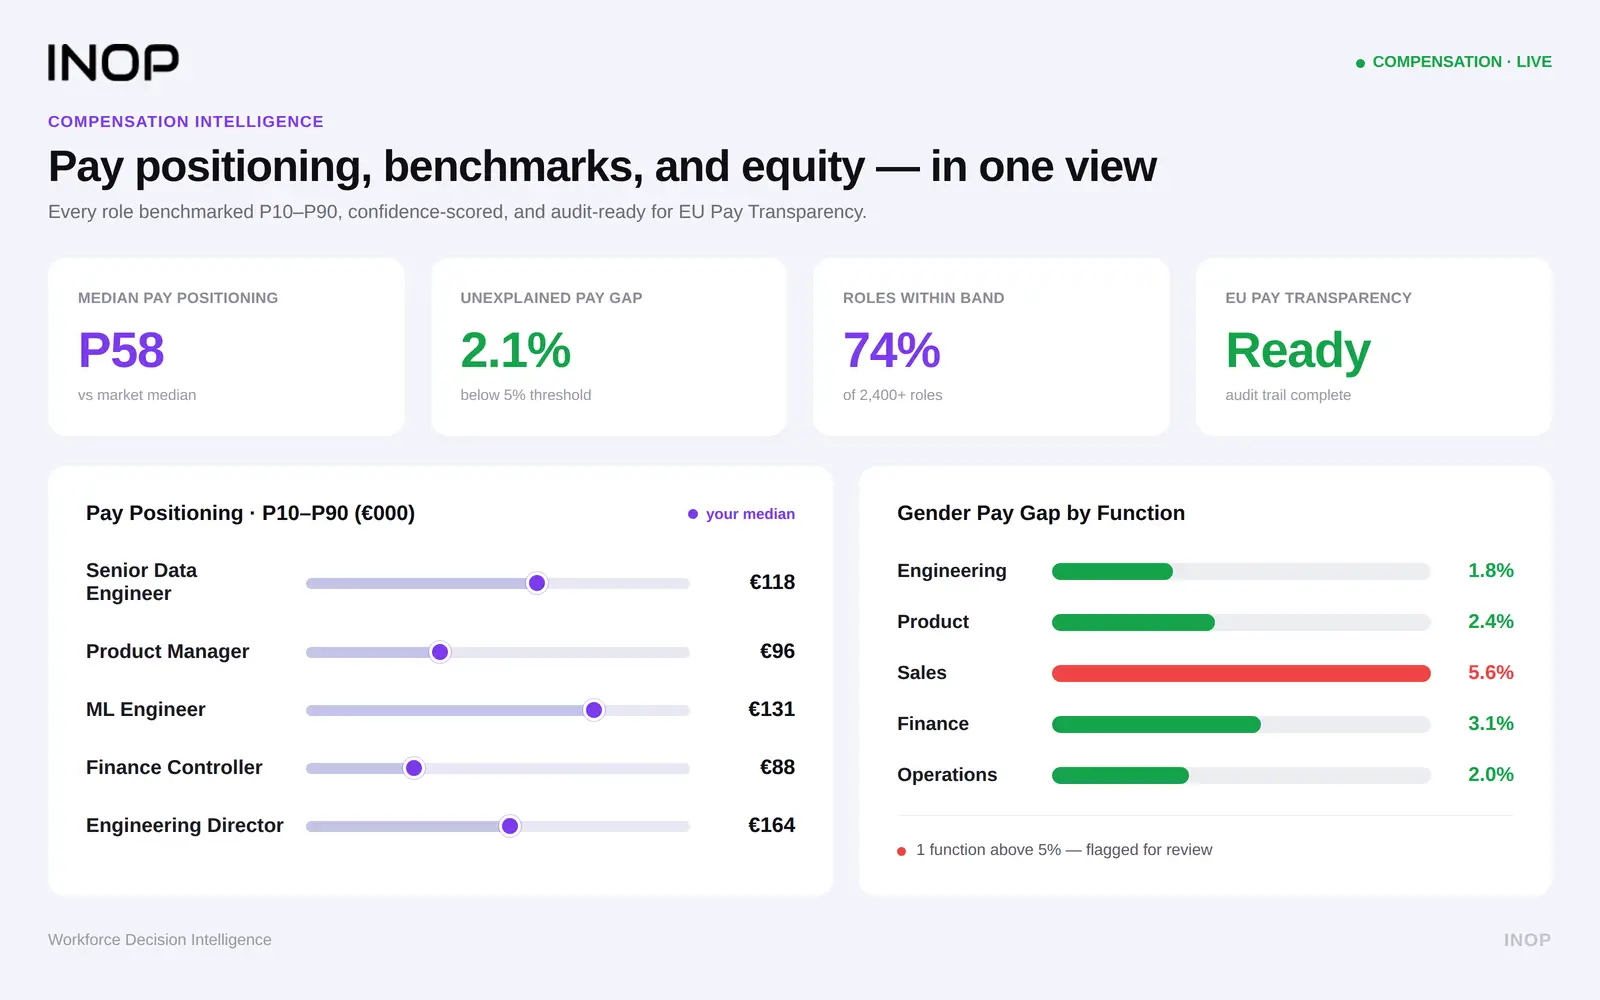
- Equity checks. It flags unexplained gaps across comparable roles. See pay parity for the internal and external fairness view.
- Audit trail. It keeps the method and the data source for every decision.
How Salary Tools Match Jobs That Do Not Fit Standard Titles
Job matching is where most salary tools lose accuracy. A hybrid role, a new role or a role that mixes skills rarely maps to a standard title. Three methods are common: matching by title, matching by job family and level, and matching by skills.
Matching by skills is the most reliable for new and hybrid roles, because pay follows the scarcity of the skill and not the label. INOP’s skills intelligence maps each role to its skills and prices them against the market. For the pay model behind it, read skills-based pay vs job-based pay. Also check whether a tool connects job descriptions, job architecture, benchmarking and salary ranges, since separate systems create gaps.
AI Compensation Tools: What AI Can and Cannot Do
AI compensation tools and AI salary benchmarking software use machine learning to match jobs, spot outliers and forecast pay movement. They speed up work that used to take weeks. They do not remove the need for judgment.
- AI helps with: cleaning job data, matching roles to market data, flagging outliers and forecasting pay trends. See predictive compensation analytics.
- AI cannot replace: choosing a market position, weighing pay against budget, or deciding whether a premium is worth paying.
Ask any AI tool how it reaches a figure. If the vendor cannot explain the method, treat the output as a hint and not an answer. INOP never assesses AI in isolation. It tests every pay decision against Strategy, Finance, People, Market, and AI and Automation, so an AI result is read in the context of the business plan.
Best Total Compensation Bands Tools: What to Check
Total compensation bands tools build pay ranges that include base pay, variable pay, equity and benefits. Before you choose one, check that it can do the following.
- Build ranges from percentile targets, such as the median, by job family and location.
- Show base, bonus, equity and benefits side by side.
- Update ranges when market data changes, not only once a year.
- Report cost against budget, by team and by scenario.
For a related use case, see tools that compare total compensation for software engineers.
Free vs Paid Salary Benchmarking Tools
Free tools are a fair place to start. They help you test a range, learn the vocabulary and sense-check a figure. Government data is the strongest free source. The U.S. Bureau of Labor Statistics Occupational Employment and Wage Statistics program publishes annual wage estimates for about 830 occupations, for the nation, states and metropolitan areas.
| Factor | Free tools | Paid tools |
|---|---|---|
| Data depth | Broad, limited detail by industry and company size | Deeper cuts by level, industry and location |
| Job matching | Mostly by title | Often by level and skills |
| Update frequency | Varies, often annual | Annual to continuous |
| Audit trail | Rarely available | Usually available |
| Best use | Early research and quick checks | Range setting, budgets and audits |
Move to a paid tool when you need to defend a decision to finance or the board, match jobs by skills, or run reviews across several countries.
Salary Tools Across Countries
Global salary comparison needs local data. Currencies, pay structures, benefit norms and legal duties differ, and one global figure rarely fits. For Europe, the Eurostat Structure of Earnings Survey provides harmonized gross earnings data across member states every four years, linked to occupation, age, education and enterprise size.
Regulation also shapes what a tool must support. The EU Pay Transparency Directive had a transposition deadline of 7 June 2026. Baker Tilly reports that employees can request information on their own pay level and the average pay of colleagues doing comparable work, and that employers with 250 or more employees must file a first pay gap report by 7 June 2027. A tool that keeps a documented method and an audit trail makes those answers easier to give.
Why Salary Tools Disagree With Each Other
Two salary tools can show different figures for the same job. The usual causes are different data sources, different job matches, different dates and different location adjustments. When figures differ, compare the method before you pick a winner, and record which source supports the decision.
Common Pitfalls of Salary Tools
Lack of Verified Data Sources
A figure without a source, a sample size and a date is a guess. Ask for all three.
Overgeneralization of Roles
Matching by title alone hides differences in scope and skills. Match on scope, level and skills.
Ignoring Geographic Nuances
A national figure hides large differences between cities and countries. Use local data for each location.
Static vs Dynamic Data
Annual data ages quickly in fast-moving skills. Check how often a tool updates and how it handles the gap between releases.
Red Flags to Watch For
- No explanation of where the data comes from.
- A single exact figure with no range or sample size.
- No way to see or audit how a job was matched.
- Results that cannot be exported to your pay and budget workflow.
- Claims of accuracy that the vendor cannot support with a method.
What Makes a Good Salary Comparison Tool?
Transparent Methodology
The tool should explain its data sources, matching method and update cycle in plain language.
Role-Specific Benchmarking
It should handle level, scope and skills, not only title, and support roles that do not fit standard job families.
Total Compensation Insights
It should show base pay, variable pay, equity and benefits, so you compare the whole package.
Pay Equity Analysis
It should flag unexplained gaps across comparable roles and keep a record of how each gap was resolved.
How to Connect Salary Data to Workforce Decisions
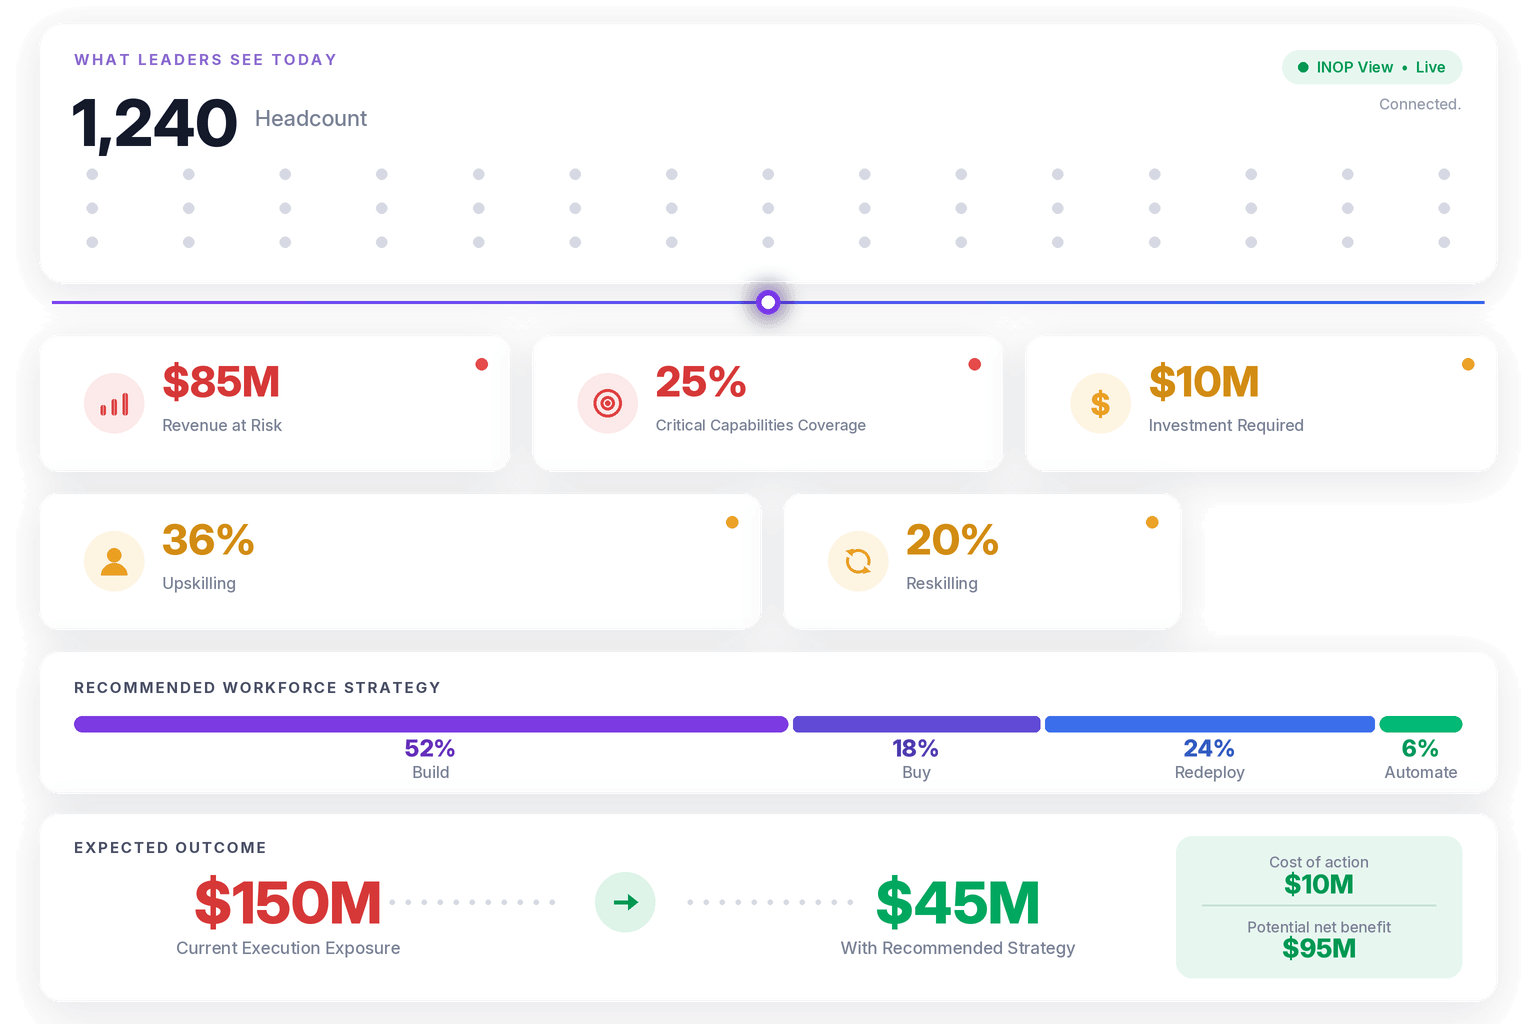
A salary tool tells you what the market pays today. It does not tell you which skills the business needs next, or whether paying a premium is the right response. That takes a link between pay data and the workforce plan. INOP’s compensation analytics platform benchmarks pay by role and skill, and its strategic workforce planning platform ties those benchmarks to the capabilities the plan requires.
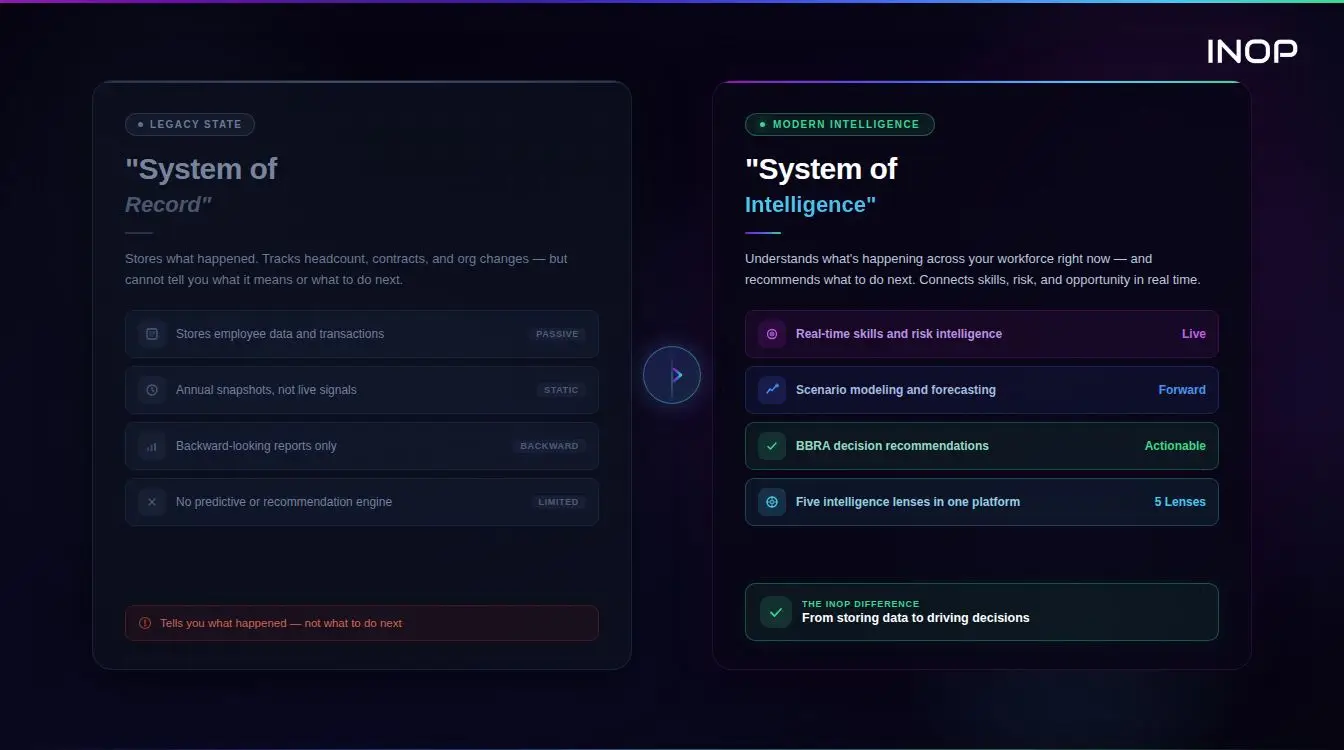
INOP answers whether leaders have the capabilities to execute their strategy today and stay AI-ready. It reads existing HR and finance data and complements the systems you already run. Each decision is tested against five intelligence lenses.
- Strategy: is the capability tied to a priority that justifies the pay?
- Finance: what does the premium cost, and what does each alternative cost?
- People: does the organization already hold adjacent skills?
- Market: what does the external market pay, and how scarce is the skill?
- AI and Automation: will automation change how much of this work people do?
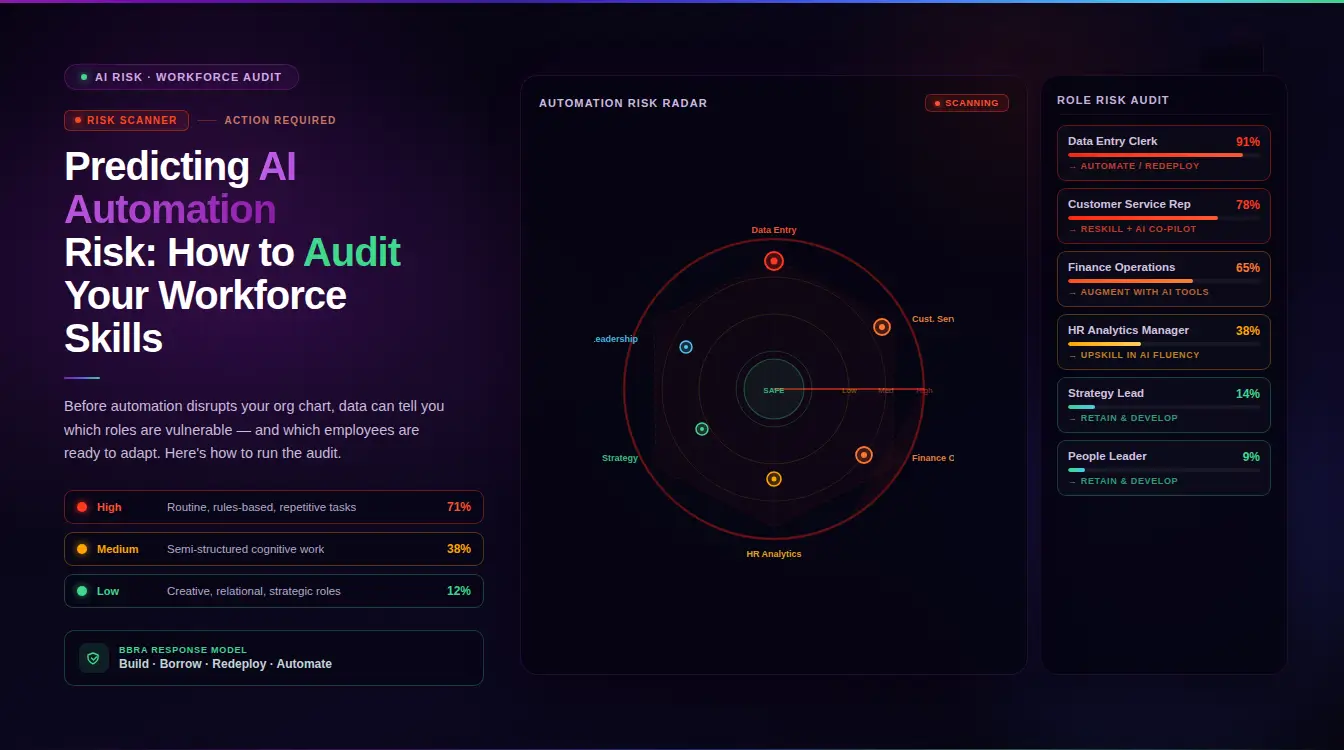
The answer feeds BBRA, INOP’s proprietary decision architecture: Build, Buy, Redeploy, Automate. When a salary tool shows a scarce skill priced well above your range, BBRA models all four pathways with their financial trade-offs across 30-day, 180-day, one-year and three-year horizons. Paying the premium is right for some skills. For others, building the skill or redeploying adjacent talent costs less over three years.
See market pay tied to your workforce plan. INOP connects salary data, skills and pathways in one decision view. Book a demo
The HR Leader’s Salary Tool Evaluation Checklist
- Data source. Is the origin of each figure stated, with sample size and date?
- Update cycle. How often does the data change, and how are gaps handled?
- Job matching. Can you see and adjust how a job was matched, including by skills?
- Total rewards. Does it cover base, variable, equity and benefits?
- Integration. Does it read your HR and finance data without manual uploads?
- Review and equity. Does it support range positioning, budget modeling and pay equity checks?
- Audit trail. Can you reproduce and defend any figure later?
Salary Tools for Private Equity Operating Partners
For private equity operating partners, salary tools are a way to compare pay structures across a portfolio on one method. The goal is to see where pay sits above market with no strategic reason, and where gaps in critical skills put the growth plan at risk.
Choose a tool that applies the same job matching and loaded-cost rules to every company, supports several countries, and links to a skill-level staffing plan. Pair it with the headcount planning guide so pay and capacity decisions use the same numbers.
Conclusion: Choose Salary Tools by Data, Not Brand
The right salary tool depends on the decision you need to make. Compare tools by data source, update frequency, job matching and audit trail, and check each vendor against the same questions. Use free data to start, paid data to defend decisions, and a platform that connects pay to the workforce plan when pay decisions affect strategy.
Compare pay data against the skills your strategy needs. INOP shows what each pathway costs across four time horizons. Book a demo
Salary Tools FAQs
How accurate is crowdsourced salary data compared to survey-based providers?
Crowdsourced data is fast and broad but unverified, so accuracy depends on sample size and how well the job is matched. Survey-based data is validated and usually more reliable for matched jobs, but it refreshes less often. Use crowdsourced data for quick checks and validated data for ranges and audits.
What is the difference between salary tools and compensation analytics?
Salary tools show market pay for a job or skill and compare it with your pay. Compensation analytics goes further: it connects pay to budget, equity, skills and workforce plans, so the data supports a decision and not only a comparison.
Are free salary benchmarking tools good enough?
They are good enough for early research and sense-checks. Government wage data is a strong free source. For range setting, audits and multi-country work, paid tools with verified data, better job matching and an audit trail are safer.
How often should salary data be updated?
Review pay against the market at least once a year during budget planning, and again when a trigger occurs, such as a new job family or a spike in turnover among critical skills. Fast-moving skills may justify a more frequent check, which is why update frequency matters when you compare tools.
How should private equity operating partners compare salary tools across a portfolio?
Pick one method for every portfolio company, with the same job matching, loaded-cost rules and market position. Check that the tool covers each country and ties pay to a skill-level staffing plan, so partners can compare companies and see where pay and growth plans do not line up.