Ask ten CHROs whether they have a skills gap, and ten will say yes. Ask them what it is costing, where it is concentrated, and which intervention will close it fastest, and the room goes quiet. That gap between awareness and action is the real problem. Addressing the skills gap is no longer about acknowledging that capability shortfalls exist. Every leadership team already knows that. The differentiator in 2026 is having a structured, repeatable set of plays that turn that awareness into measurable workforce outcomes.
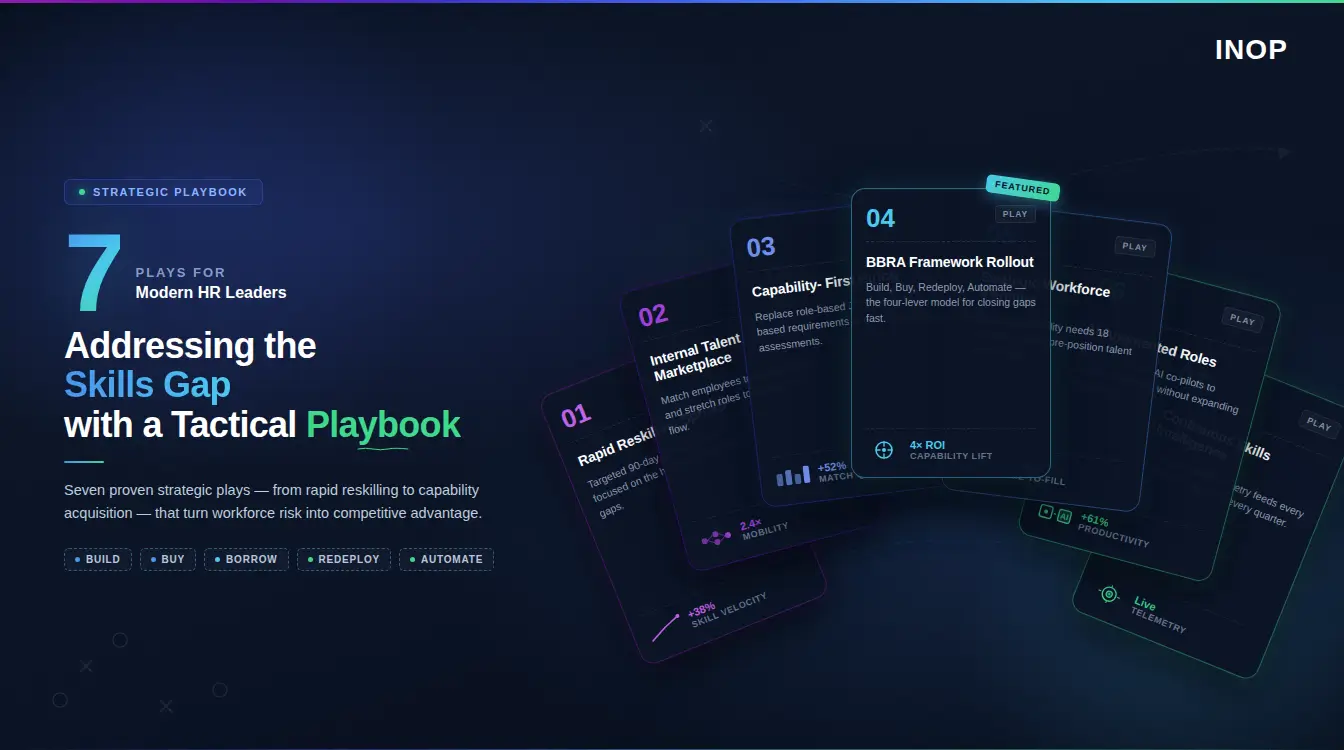
This article lays out seven strategic playbooks that modern HR leaders are using to do exactly that. Each one is practical, grounded in financial logic, and designed to work as part of a connected system rather than as a standalone initiative. Throughout, the thread tying them together is INOP’s approach to workforce intelligence: the idea that capability decisions should be as data-driven, financially defensible, and strategically aligned as any other major investment a business makes. By the end, you will have a clear sense of which plays to run, in what order, and how to measure whether they are working.
Why the Skills Gap Demands a Playbook Approach
The scale of the challenge has outgrown ad hoc responses. The World Economic Forum estimates that 44% of workers’ core skills will change within five years, and Lightcast data shows that 32% of the skills required in the average job changed in just three years, approaching 75% in some high-demand roles. At a macro level, the global skills gap costs an estimated $8.5 trillion annually in lost productivity and unrealized output.
The numbers are sobering, but they are also a trap. They create pressure to act without telling you what to do. A playbook approach solves this by giving HR leaders a defined set of moves, each with a clear purpose, cost profile, and success metric. Instead of launching a training program because training feels productive, you run the play that the data says will deliver the highest return for the specific gap you are facing.
This shift matters because most skills initiatives still fail for predictable reasons. Seventy percent of digital transformation efforts fail due to a lack of necessary skills, and a large share of skills programs stall because they are launched without the underlying data infrastructure to support them. The playbooks below are built to avoid that fate.
Build the Skills Intelligence Foundation Before Anything Else
Every other play depends on this one. You cannot close a gap you cannot see clearly, and you cannot prioritize what you have not measured. The first playbook is to build a genuine skills intelligence foundation.
This is where most organizations underinvest. Only 26% of HR leaders say they have a robust skills taxonomy in place to guide workforce planning, according to Deloitte’s Human Capital Trends research. Without that taxonomy and the inventory it supports, every subsequent decision rests on guesswork.
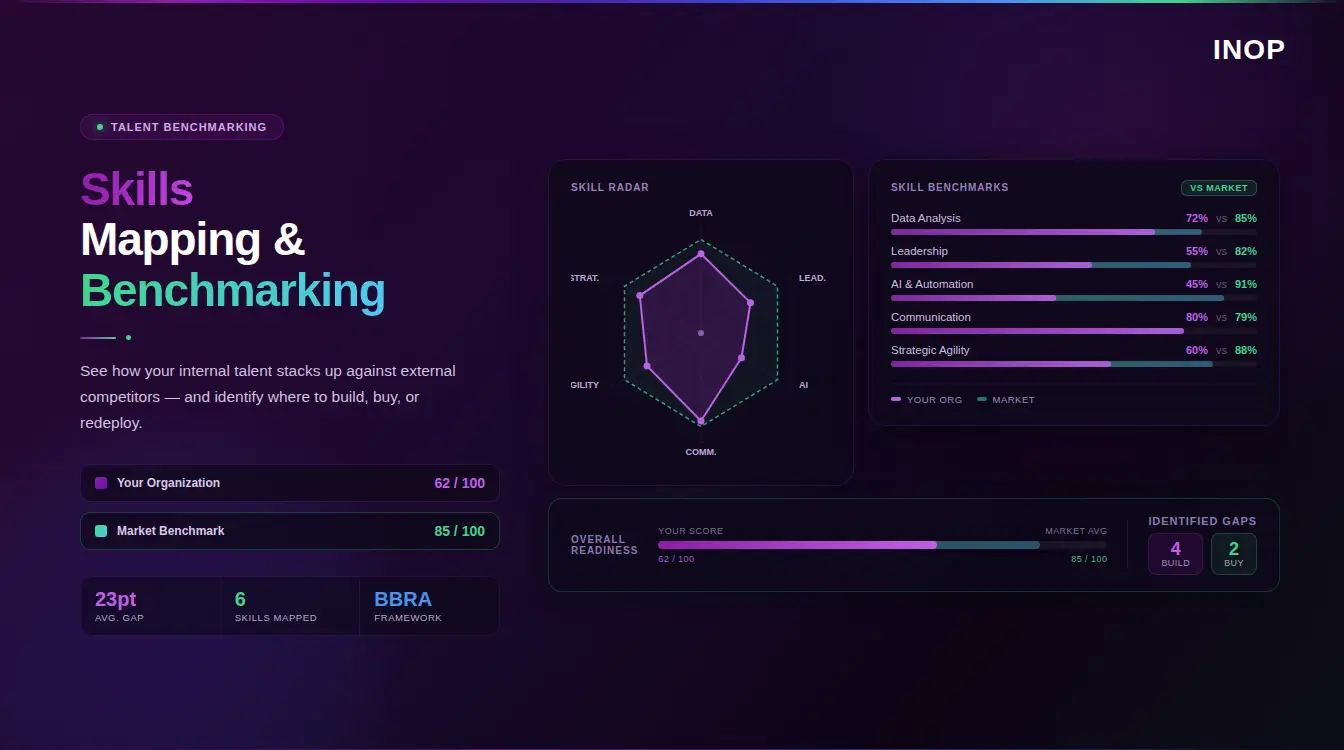
A skills intelligence foundation does three things. It inventories actual capability at the role and individual level, capturing proficiency depth rather than just whether a skill is listed somewhere. It benchmarks that internal picture against what your strategy will demand over the next one to three years. And it identifies the delta, the specific gaps that matter most to execution.
Most skills analytics tools stop at identifying the gap. They show you that capability is thin in a given function and leave it there. That is useful but incomplete. The question that matters to a CFO or a board is what that gap is costing the business, and answering it requires connecting skills data to financial and operational context. That connection is what separates true skills intelligence from basic gap reporting, and it is the reason this play comes first. Everything downstream is more accurate when the foundation is solid. Research shows that top-performing skills programs reach 80% skills data accuracy before launch; those that rush past this step spend the following year rebuilding trust they failed to establish.
Quantify the Financial Exposure of Every Major Gap
Once you can see your gaps, the next play is to translate them into the language the rest of the executive team speaks: money. This is what moves workforce strategy from an HR concern to a business priority.
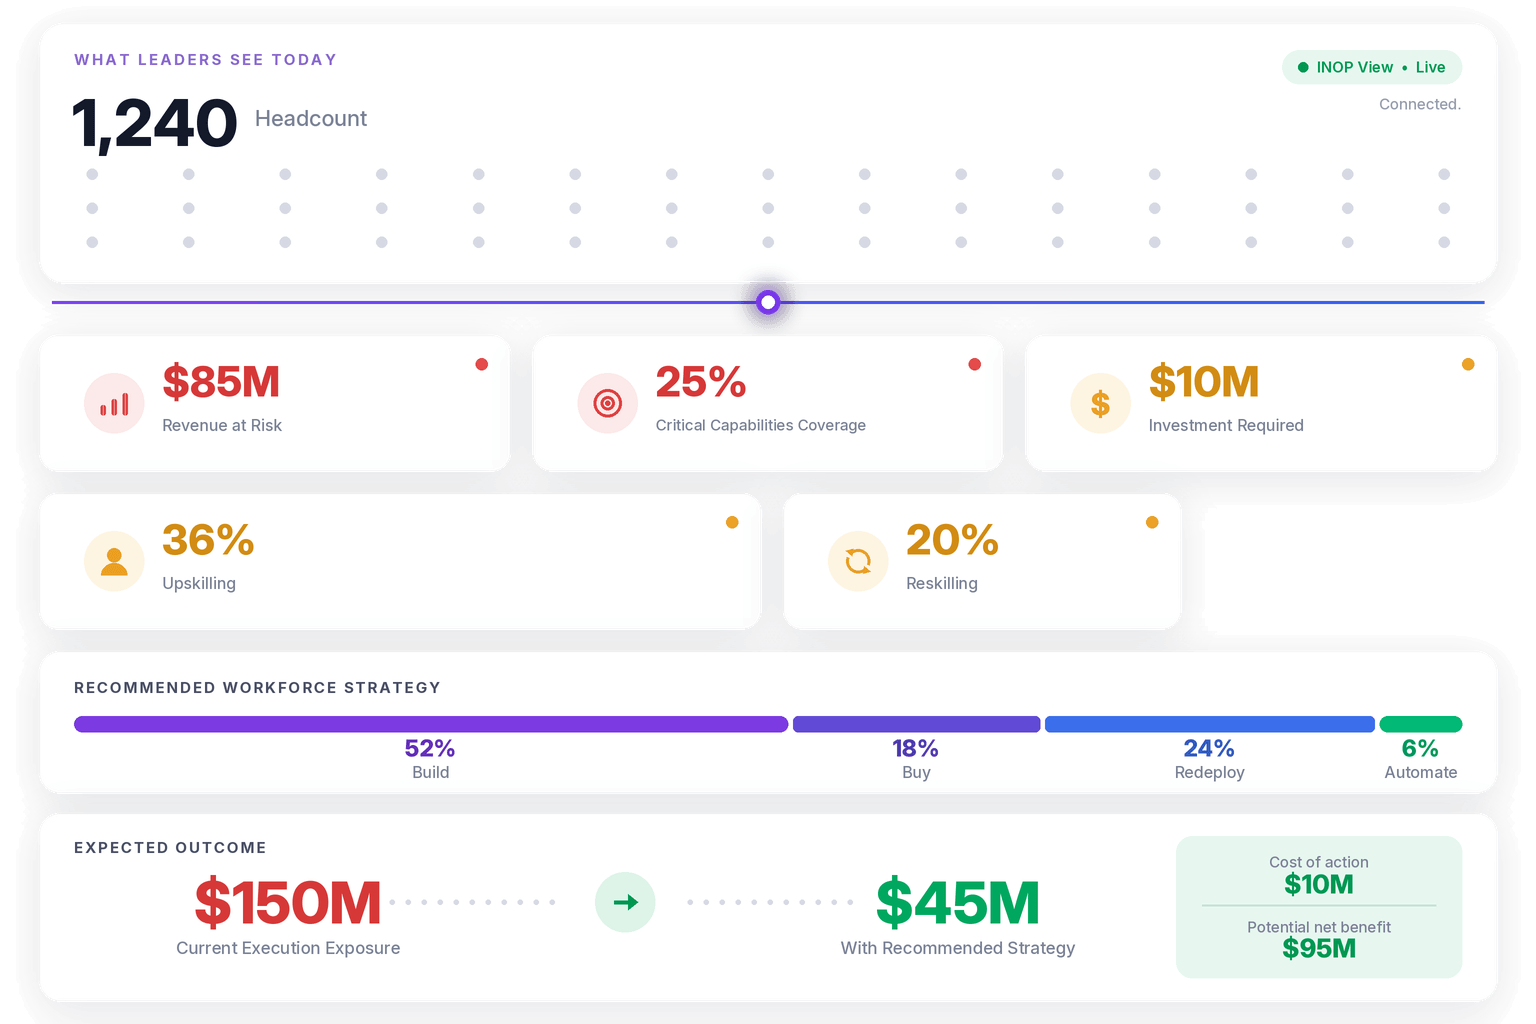
INOP’s workforce intelligence architecture organizes this translation across five analytical lenses: Strategy, Finance, People, Market, and AI/Automation. The Finance lens is where gap quantification happens, and it covers five distinct cost domains.
Productivity loss is the most direct. A role generating output at 65% of potential because of a capability shortfall is a measurable drag, calculable by dividing annual compensation by working days and applying the shortfall. Vacancy cost is the second; SHRM data shows the average cost per hire now exceeds $5,000, and for a $100,000 role, each day a position sits open represents roughly $450 in lost productivity. Execution risk is the third, capturing the revenue deferred when critical projects slip because the team lacks a needed skill. Turnover amplification is the fourth, reflecting that capability gaps drive both underperformance and attrition. And innovation opportunity cost is the fifth, the value of growth initiatives never pursued because the capability to execute them does not exist.
Summing these across your prioritized gaps produces a total financial exposure figure. That single number changes the conversation. It lets you walk into a budget discussion not with a request to “address talent risk” but with a quantified exposure and a return-on-investment case for closing it.
Want to see your skills gap translated into a financial exposure number? Book a demo with INOP and explore how our platform connects capability data to the financial language your executive team already speaks.
Run the BBRA Decision Framework on Each Gap
Knowing the cost of a gap tells you it is worth closing. It does not tell you how. The third playbook is to apply a structured decision framework that compares your options head to head. This is where INOP’s BBRA framework does the heavy lifting.
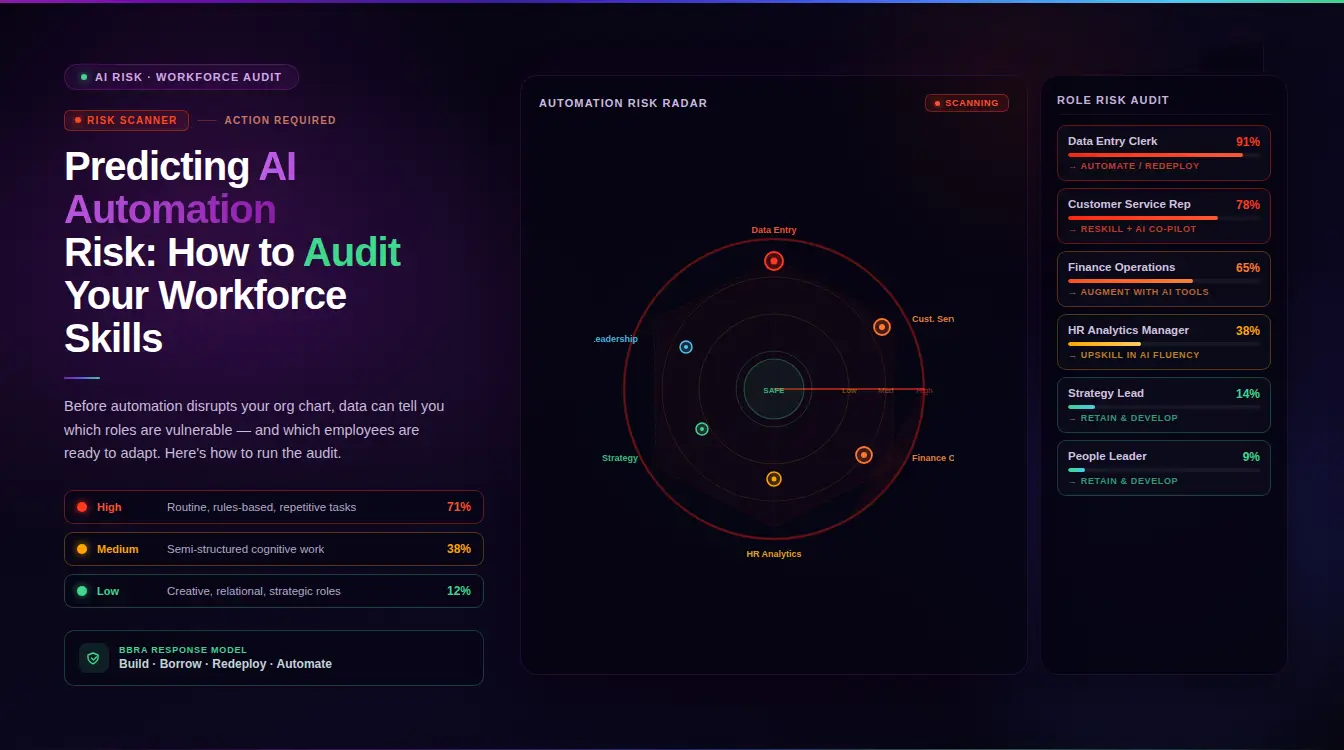
BBRA stands for Build, Buy, Redeploy, and Automate. It is INOP’s proprietary decision architecture for converting skills intelligence into workforce action, and it forces a deliberate comparison of four distinct paths rather than a default to whichever feels most familiar.
Build means developing the capability internally through structured learning. It carries the lowest unit cost per skill but the longest timeline. Seventy-nine percent of L&D professionals agree it is less expensive to reskill a current employee than to hire a new one, which makes Build the right answer for gaps that are strategic but not urgent.
Buy means external hiring. It is faster but considerably more expensive, and when the skill is scarce in the market, it carries real execution risk. The candidate you planned for may not be available when you need them, or may cost far more than your model assumed.
Redeploy means moving people who already hold the needed capability from elsewhere in the organization. It is the most consistently overlooked option because it depends entirely on having a high-quality internal skills map, the foundation built in the first playbook. When the data exists, Redeploy is often the fastest and most cost-effective path. Organizations with strong internal mobility see meaningful payback: retention rates run 34% higher in firms that offer internal mobility through reskilling.
Automate evaluates whether a technology-enabled process can replace the capability requirement entirely, or free human capacity for higher-value work. As AI reshapes the task composition of roles, this lever grows more important every quarter.
The discipline of BBRA is that it produces a defensible recommendation for each gap, with a business case attached, rather than a reflexive investment in training.
Make Internal Mobility a Default, Not an Exception
The fourth playbook deserves its own treatment because it is where so much value leaks out of organizations. Most companies hire externally for roles that could be filled internally, simply because they cannot see the internal candidates.
The cost of this blind spot is substantial. Preventable turnover, including exits driven by career stagnation, accounted for 63% of all departures in 2024, according to the Work Institute. Much of that is people leaving because they could not see a path forward inside the organization, while the organization simultaneously hired outsiders into the very roles those people wanted.
Internal talent marketplaces are becoming standard infrastructure for solving this, with adoption climbing to 35% in 2025 from 25% the previous year. But the technology alone is not enough. The plays that move the numbers share a trait: managers stop acting as gatekeepers and start acting as accelerators. Employees adopt skills systems three to five times faster when they see their manager actively using the system rather than merely endorsing it.
Making mobility the default means building transparent pathways, surfacing internal candidates before opening external requisitions, and tying manager performance goals to internal moves, not just to retention. The financial logic is straightforward: every internal fill avoids the recruitment cost, the productivity ramp, and the cultural risk of an external hire.
Calibrate Against Real Market Data, Not Industry Averages
The fifth playbook addresses a quieter but consequential error: making decisions on generic data. Industry-average compensation benchmarks and broad skills demand reports give directional signal, but they reflect the average of a large, heterogeneous population. Your organization is not the average.
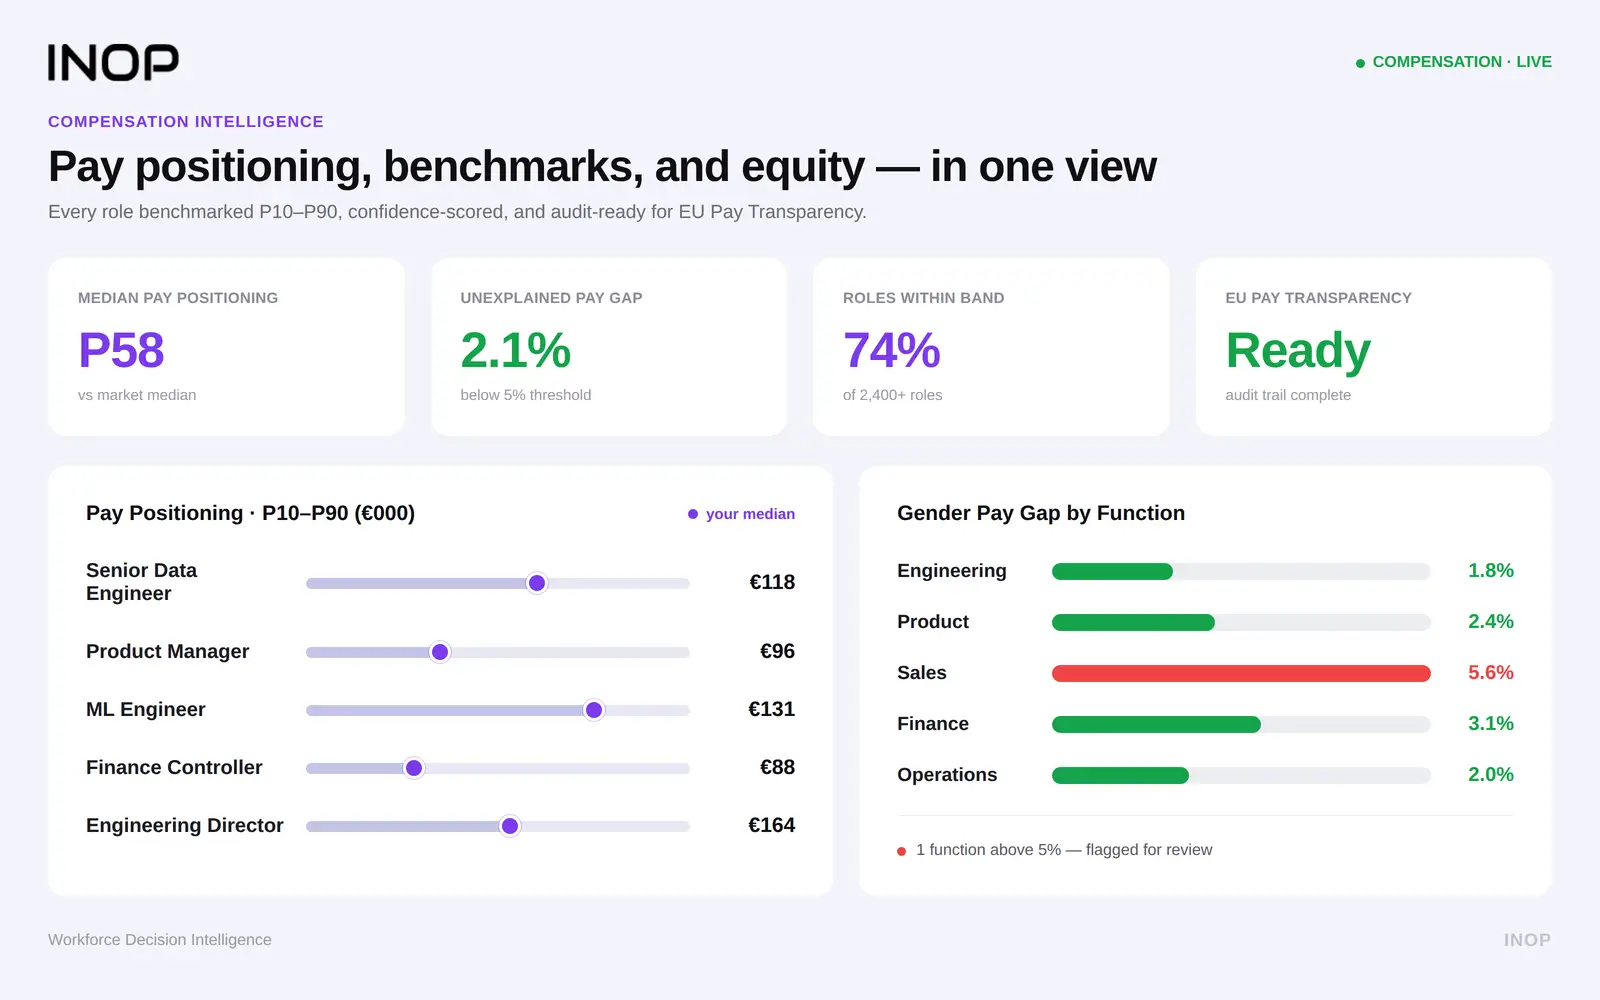
The Market lens in INOP’s architecture exists precisely to correct this. INOP’s compensation analytics capabilities incorporate live market data so that internal gap analysis is always benchmarked against what the actual talent market can supply, in the geographies and role categories where you genuinely compete, and at what cost.
This calibration directly improves the BBRA decision. If a skill is abundant and reasonably priced in your specific market, Buy becomes lower risk. If it is scarce or expensive, the analysis shifts toward Build or Redeploy. Using national averages when your market is significantly tighter or looser produces a business case that will not survive contact with reality. The play here is simple but rigorous: filter every external benchmark to the markets you actually operate in before you let it inform a decision.
Treat Skills Data as a Living System
The sixth playbook is about cadence. A skills gap analysis built on a static snapshot is partially wrong the moment it is published, because skills profiles, market conditions, and organizational strategy all change continuously.
Consider the velocity. With 44% of core skills shifting within five years and a third of job skills turning over in three years, a model refreshed annually is telling you where your organization was, not where it is. The plays that work treat skills data as a live system connected to ongoing inputs, updated as employees develop, depart, or move, and as market signals shift.
This is also where manager behavior compounds. Research suggests the effect of manager feedback on skills growth kicks in somewhere between 50 and 80 feedback instances; feedback delivered once per quarter will not move adoption. The living-system mindset applies to the human cadence as much as the data cadence. Both need to be continuous to produce results.
Ready to build a workforce intelligence model that updates in real time? Book your demo today and see what continuous skills intelligence built for your organization looks like.
Connect Workforce Capability to Enterprise Strategy and Finance
The seventh and final playbook is the one that elevates HR from function to strategic partner. It is the deliberate connection of workforce capability to the broader strategy and financial planning of the enterprise.
This is the difference between people analytics that report on the past and workforce intelligence that informs the future. INOP is built to be this connective layer, integrating skills data, people analytics, compensation benchmarks, and strategic workforce requirements into a single, continuously updated view that boards and executive teams can act on. INOP’s strategic workforce planning methodology is the framework that ties role-level capability assessment directly to organizational strategy and financial planning.
When this connection is made well, the results compound. Companies with advanced upskilling programs are three times more likely to report revenue growth, and the most effective organizations are reframing development budgets not as “learning spend” but as turnover-prevention and capability-building investment with measurable returns.
Why This Matters for PE Operating Partners
This final play resonates particularly strongly with private equity operating partners, a group for whom workforce capability is increasingly a core diligence and value creation concern. Operating partners need to know whether a portfolio company’s workforce can execute the value creation plan, what capability gaps stand between current performance and plan targets, and what it realistically costs to close them within the required timeline.
Generic workforce data cannot answer those questions. The connected, financially grounded model that this playbook produces can. For operating partners, INOP’s BBRA framework and five-lens architecture translate workforce capability into the same financial language they already use to evaluate portfolio performance, making people decisions as defensible as capital allocation decisions. That is a capability that extends the reach of skills intelligence well beyond the traditional HR remit.
Bringing the Playbooks Together
These seven plays are not a menu to pick from. They are a sequence that builds on itself. The skills intelligence foundation makes financial quantification possible. Quantification makes the BBRA decision meaningful. The BBRA decision elevates internal mobility and redeployment. Market calibration sharpens every choice. The living-system cadence keeps the whole model accurate. And the connection to enterprise strategy is what gives all of it weight in the boardroom.
Run individually, any one of these plays will help. Run together, as a connected system, they transform how an organization approaches addressing the skills gap, shifting it from a recurring source of anxiety to a genuine source of competitive advantage.
Conclusion
The organizations pulling ahead on workforce capability are not the ones with the biggest training budgets or the most ambitious reskilling slogans. They are the ones running a disciplined, connected set of plays grounded in real data and financial logic. Addressing the skills gap effectively means building a skills intelligence foundation, quantifying exposure in financial terms, applying the BBRA framework to every major gap, making internal mobility the default, calibrating against real market data, treating skills data as a living system, and connecting all of it to enterprise strategy.
The thread running through every play is the same: capability decisions deserve the same rigor as any other strategic investment. When HR leaders bring that rigor, they stop reacting to skills shortages and start managing them as a controllable, measurable dimension of business performance.
If you are ready to build this system inside your own organization, explore how INOP’s skills intelligence platform brings these playbooks together into a single connected model. And if you are already running some of these plays and want to compare notes on what is working, leave a comment below. The sharpest thinking in this space comes from practitioners, not from reports.
Frequently Asked Questions
What does addressing the skills gap actually involve beyond training?
Training is one lever among four, not the whole answer. Addressing the skills gap effectively means first building a clear picture of where your gaps are and what they cost, then deliberately choosing among four interventions: Build (training and development), Buy (external hiring), Redeploy (moving existing internal talent), and Automate (replacing the requirement through technology). Defaulting to training without that analysis often means investing in the slowest option for a gap that needed a faster one.
How do you measure the financial impact of a skills gap?
You quantify exposure across five cost domains: productivity loss from underperforming roles, vacancy cost from unfilled positions, execution risk from delayed projects, turnover amplification from gap-related attrition, and innovation opportunity cost from growth initiatives you cannot pursue. Summing these for each prioritized gap produces a total financial exposure figure that can be weighed against the cost of the chosen intervention to calculate a return on investment.
What is INOP’s BBRA framework?
BBRA stands for Build, Buy, Redeploy, and Automate. It is INOP’s proprietary decision framework for translating skills intelligence into workforce action. Once a gap is identified and its financial exposure quantified, BBRA provides a structured way to compare the four intervention paths, each with a distinct cost, timeline, and risk profile, and produce a defensible recommendation rather than a reflexive investment in any single approach.
Why is internal mobility so important for closing skills gaps?
Internal mobility is often the fastest and most cost-effective way to close a gap, because the capability may already exist inside the organization. It also addresses retention directly. Preventable turnover, much of it driven by career stagnation, accounts for a majority of departures, and organizations with strong internal mobility see materially higher retention. The constraint is visibility: without a high-quality internal skills map, the internal candidates who could fill a gap remain invisible, and organizations hire externally by default.
How often should skills gap analysis be updated?
It should be treated as a continuous system rather than an annual exercise. With a significant share of job skills turning over within three years, a model refreshed once a year reflects where the organization was, not where it is. The most effective implementations connect the analysis to live data inputs and update continuously as employees develop or move and as market conditions shift.
How can PE operating partners use these playbooks?
Operating partners apply this approach primarily to execution risk assessment during diligence and value creation: determining whether a portfolio company’s workforce can deliver on the plan, identifying the capability gaps that threaten plan targets, and quantifying the realistic cost and timeline of closing them. The financial framing of the model maps directly onto the language operating partners already use to evaluate portfolio performance, making workforce decisions as rigorous as capital allocation.
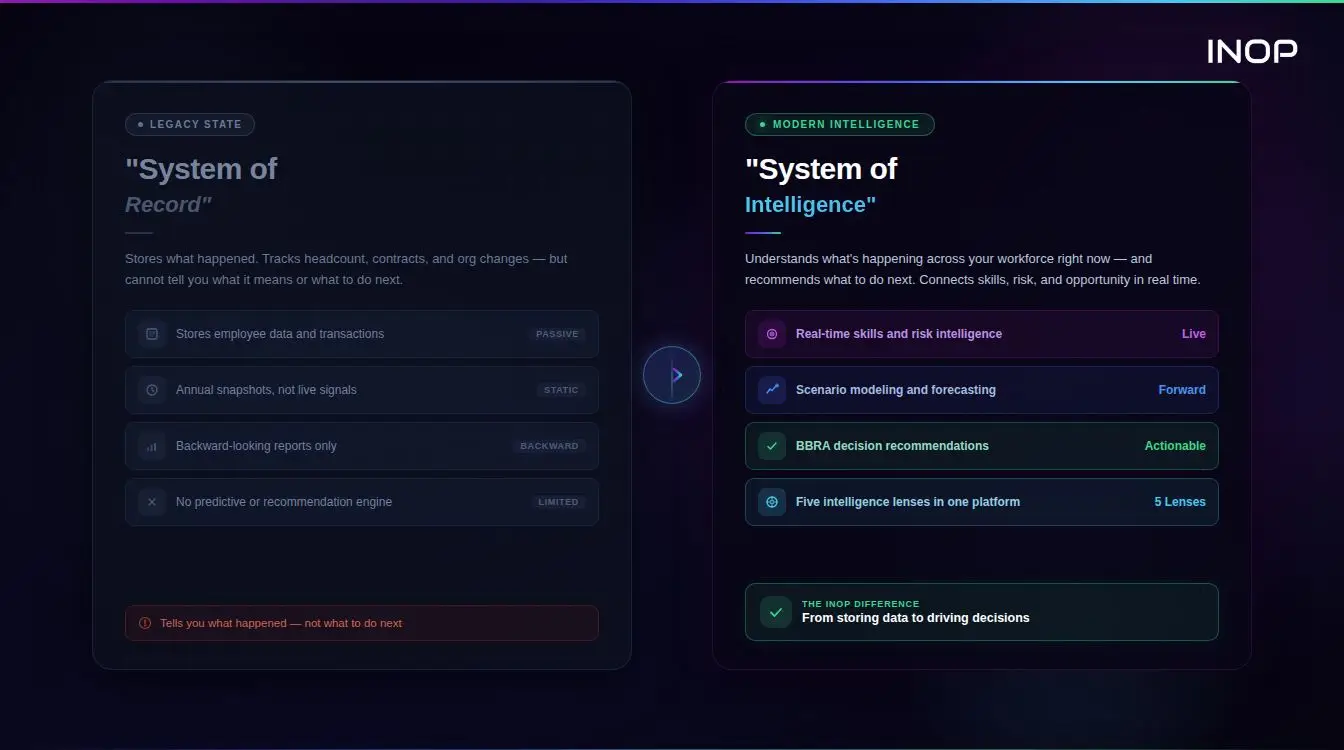
What is the difference between people analytics and workforce intelligence?
People analytics typically reports on what has already happened: turnover rates, engagement scores, headcount trends. Workforce intelligence connects capability data to strategy, market context, and financial reality to inform forward-looking decisions. The distinction matters because reporting on the past does not tell a leadership team what to do next. Workforce intelligence, as INOP delivers it through its five-lens architecture, answers the harder question of which capability investments will produce the best return for the strategy ahead.
Book a Demo
Make confident workforce decisions that support strategy and value creation.