Knowing how to benchmark salaries is now a core skill for HR and reward leaders. Salary benchmarking compares what you pay for each role with what the market pays for comparable work, so you can set fair, competitive and defensible pay ranges. The challenge is that market pay moves faster than annual surveys can track. This guide shows how to benchmark salaries step by step, which salary benchmarking data sources to use, how to read percentiles, how to compare pay bands to market data, and how real-time compensation data keeps your ranges current.
For a definition of the term and its main types, read what a compensation benchmark is. This article focuses on the method.
How to Benchmark Salaries: A Step-by-Step Guide
Follow these seven steps in order. Each one feeds the next.
Step One: Gather and Validate Your Internal Data
Pull base pay, variable pay, job title, level, location, tenure and contract type for every employee. Check for missing fields, duplicate records and out-of-date titles. Benchmarking bad internal data produces confident but wrong answers.
Step Two: Set Your Compensation Philosophy
Decide where you want to sit against the market for each role family: below, at or above the median. Many organizations pay at the median for most roles and above it for scarce, business-critical skills. Write the policy down, because every later decision refers back to it.
Step Three: Choose Your Salary Benchmarking Data Sources
Use more than one source, and record the date, region and method of each. The next section compares the main types.
Step Four: Match Roles to the Market
Match each internal role to market data by job content and level, not by title alone. Two roles with the same title can do very different work. Group roles into job families and levels first, then match the family. Roles that do not map cleanly may need skill-level pricing.
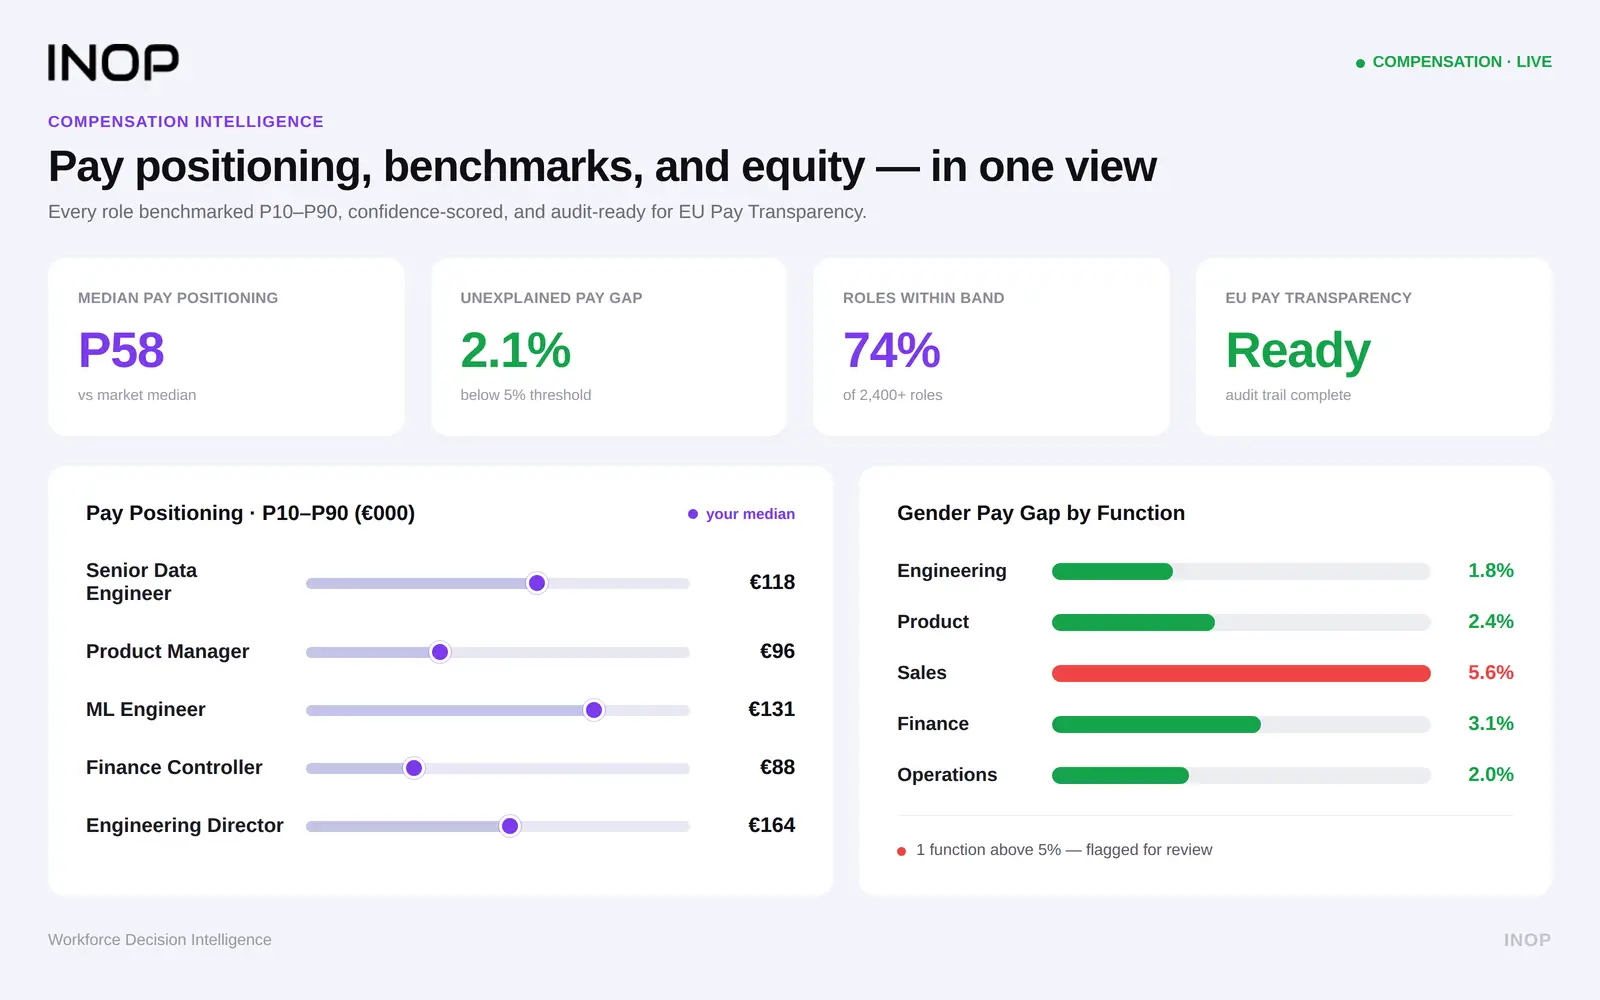
Step Five: Read the Percentiles and Calculate Your Position
Compare each employee’s pay with the market percentiles for the matched role. A simple ratio shows the gap: an employee paid €54,000 against a market median of €60,000 sits at 90 percent of market.
How to Benchmark Salaries Using Market Percentiles
Market data is usually reported as P25, P50 and P75. Here is what each one means.
| Percentile | What it means | Typical use |
|---|---|---|
| P25 (25th percentile) | A quarter of the market pays less than this | Entry point for a range or a lag-the-market policy |
| P50 (median) | Half the market pays less, half pays more | Range midpoint for a match-the-market policy |
| P75 (75th percentile) | Three quarters of the market pays less | Target for scarce or critical skills |
Step Six: Set or Adjust Pay Ranges
Set the range midpoint at your target percentile, then define the minimum and maximum. Senior and specialist roles usually need wider ranges than entry roles. For the full method, read building skills-based pay bands.
Step Seven: Review and Monitor Regularly
Review benchmarks at least once a year, and more often for roles where pay moves quickly. Track how many employees fall below the minimum or above the maximum, and how that changes over time.
Salary Benchmarking Data Sources
No single source is complete. Combine at least two types and weight them by quality and relevance.
| Source type | Strengths | Limits |
|---|---|---|
| Compensation surveys | Structured job matching, broad coverage of established roles | Published with a time lag, costly, slow to reflect new roles |
| Real-time market data | Current, granular by role, skill and location | Needs careful cleaning and matching |
| Public statistics | Free, transparent methods, large samples | Broad occupation groups, annual release cycles |
| Crowdsourced salary sites | Quick directional check | Self-reported, uneven samples, hard to verify |
Public data is a good free starting point. The US Bureau of Labor Statistics publishes annual pay estimates for about 830 occupations through its Occupational Employment and Wage Statistics program. In Europe, Eurostat’s Structure of Earnings Survey gives comparable earnings data across member states, collected every four years. For a deeper comparison, read real compensation data vs market surveys.
Static vs Real-Time Compensation Data
| Dimension | Static benchmarking | Real-time benchmarking |
|---|---|---|
| Update frequency | Annual or semi-annual | Continuous |
| Fit for fast-moving roles | Weak | Strong |
| New and hybrid roles | Often missing | Usually covered |
| Effort per cycle | High, manual | Lower, automated |
| Best use | Annual structure review | Ongoing range checks and pay decisions |
Pay costs keep moving between survey cycles. The US Bureau of Labor Statistics Employment Cost Index shows total compensation costs rose 3.4 percent in the 12 months to September 2026. In fast-moving skills, the shift can be larger, which is why real-time data matters. See real-time compensation analytics and the overview of real-time analytics platforms.
AI Pay Benchmarking
AI helps with the hardest parts of benchmarking: matching roles by job content instead of title, inferring skills from job descriptions, and cleaning large data sets. Keep a person in the loop to review matches for unusual or senior roles.
How to Compare Pay Bands to Market Data
Once ranges are set, check them against the market with two measures.
- Compa-ratio: an employee’s pay divided by the range midpoint.
- Range penetration: how far through the range an employee sits, from minimum to maximum.
AIHR gives a clear example in its guide to salary range penetration: a $50,000 salary in a $45,000 to $60,000 range has a compa-ratio of 95 percent and a range penetration of 33 percent. Compare your range midpoints with the current market P50 for each role. If the market has moved more than a few percent, adjust the range before the next pay review. Then check fairness across groups with a pay parity review.
Salary Benchmarking and the EU Pay Transparency Directive
The EU Pay Transparency Directive makes benchmarking a compliance task as well as a market one. The transposition deadline was 7 June 2026, and employers with 250 or more employees file their first pay gap report by 7 June 2027, according to Baker Tilly. Smaller employers follow later timelines set by each member state.
The Directive expects employers to explain pay differences with objective, gender-neutral criteria. Documented benchmarking does that: it shows that ranges come from market data and a written policy, not from individual negotiation. Check the national rules where you operate and take legal advice on details.
Benchmarking Total Rewards, Not Only Base Salary
Base salary is only part of the package. Benchmark bonuses, equity, allowances and key benefits as well, especially for senior roles where variable pay makes up a large share. For leadership roles, read executive compensation benchmarking.
Skills-Based Salary Benchmarking
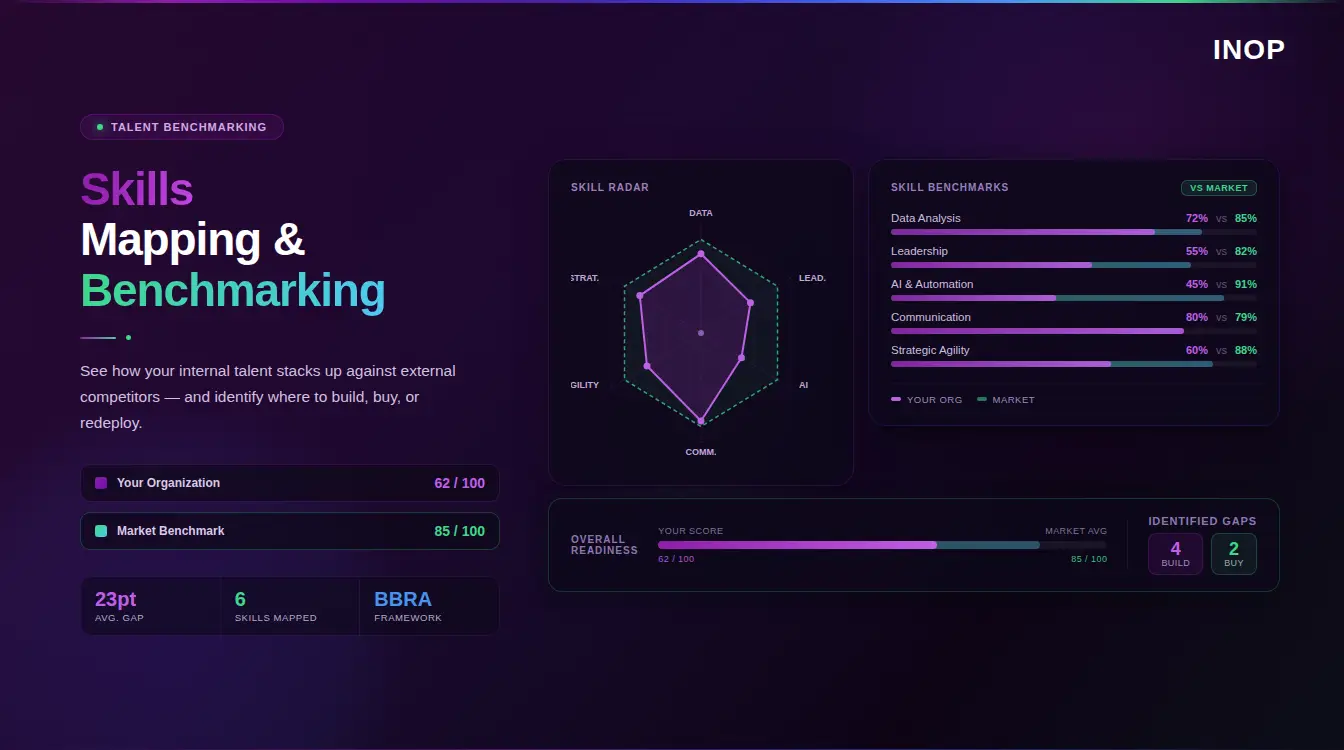
Two people in the same role can hold very different skills. Skills-based benchmarking prices the skill combination, not only the title, which matters for scarce skills such as AI, data and security. INOP’s skills intelligence verifies skills from existing data so they can be priced against the market.
How to Benchmark Salaries for Global and Remote Roles
Geographic Pay Differentials
Pay levels differ by country and city. Benchmark against the labor market where the employee works, and decide whether remote roles follow a location-based or a single national range. For more, read compensation benchmarks for remote and hybrid roles.
Currency, Inflation and Cost of Labor
Convert data at a consistent rate and date, and separate cost of labor (what employers pay for the work) from cost of living (what it costs to live there). Ranges should follow cost of labor.
Common Salary Benchmarking Pitfalls
- Matching on title only. Match on job content and level.
- Relying on one source. Blend sources and note their dates.
- Using stale data. Age old data forward or replace it with current data.
- Ignoring internal equity. Market moves can create pay compression between new and long-serving employees.
- Benchmarking base pay only. Include variable pay and key benefits.
- No written policy. Without a target percentile, decisions drift.
For more, see the biggest compensation benchmarking mistakes.
Benchmark every role against live market data. INOP connects pay, skills and market data in one view. Book a demo
The ROI of Salary Benchmarking
The return comes from avoided costs. Gallup reports that replacing an employee costs one-half to two times the employee’s annual salary, according to its turnover research. Benchmarking reduces that risk by flagging people paid well below market in scarce roles before they leave. It also avoids overspend where pay sits well above market without a reason, and it lowers compliance risk under pay transparency rules.
Measure it with a few indicators:
- Share of employees below range minimum, by role family.
- Regretted exits in roles flagged below market.
- Spend on adjustments compared with replacement cost avoided.
- Unexplained pay gaps between comparable groups.
How INOP Benchmarks Salaries Inside Workforce Decisions
INOP answers whether leaders have the capabilities to execute their strategy today and stay AI-ready. It never assesses AI in isolation. It tests every pay decision against five intelligence lenses.
- Strategy: which roles and skills matter most to the plan?
- Finance: what does each pay adjustment cost over time?
- People: which skills does the workforce already hold?
- Market: where does pay sit against live market data?
- AI and Automation: how will automation change the work and its value?
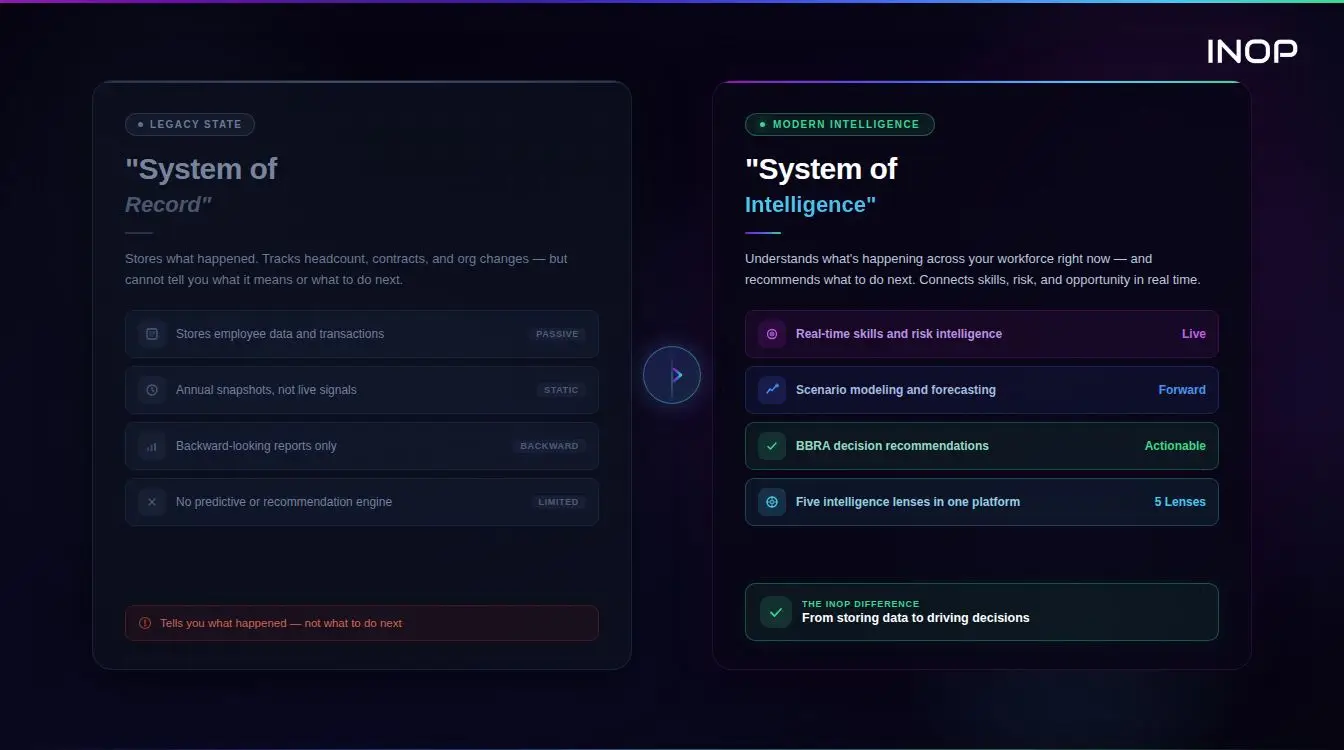
The result feeds BBRA, INOP’s proprietary decision architecture: Build, Buy, Redeploy, Automate. BBRA models all four pathways with financial trade-offs across 30-day, 180-day, one-year and three-year horizons. That shows when a pay premium for a scarce skill is worth it and when developing or redeploying people costs less. INOP’s compensation analytics platform benchmarks pay by role, skill and location, and its strategic workforce planning platform links pay to the plan.
Salary Benchmarking for Private Equity Operating Partners
For private equity operating partners, consistent benchmarking across the portfolio shows where pay creates retention risk in critical roles, where it runs above market without reason, and what correcting it would cost. That supports value-creation plans and clean pay stories in diligence and at exit. Use one method and one set of sources across companies so results are comparable.
Conclusion: Benchmark Continuously, Decide With Evidence
Benchmarking salaries well means clean internal data, a written policy, careful role matching, blended sources and regular review. Real-time compensation data closes the gap between survey cycles, so ranges stay current and pay decisions stay defensible. Start with the roles that matter most to your strategy, and build from there.
Ready to keep pay ranges current with live market data? INOP links pay, skills and cost in one view. Book a demo
How to Benchmark Salaries FAQs
How do you benchmark salaries?
Validate your internal data, set a compensation philosophy, choose data sources, match roles by job content and level, compare pay with market percentiles, set or adjust ranges, and review regularly.
What do salary percentiles mean in benchmarking data?
They are market percentiles. P25 means a quarter of the market pays less, P50 is the median, and P75 means three quarters of the market pays less. Your target percentile depends on your pay policy for each role.
How often should we update salary benchmarking data?
At least once a year for the full structure, and more often for roles where pay moves quickly. Real-time data lets you check ranges continuously between reviews.
Should we benchmark total compensation or only base salary?
Benchmark total compensation where variable pay, equity or benefits make up a meaningful share, especially for senior roles. Base salary alone can hide large differences.
How does salary benchmarking help private equity operating partners?
It gives a consistent view of pay against the market across portfolio companies, shows retention risk in critical roles and prices the cost of correcting gaps before they affect the plan.