Workforce optimization is the strategic process of aligning people, processes, and technology to maximize organizational productivity while controlling total labor costs. According to Resource Group Holdings’ 2026 analysis, organizations that implement AI-driven workforce optimization reduce operational labor bottlenecks and cut costs by up to 21%. McKinsey’s research on smarter resource allocation, typically AI-assisted, puts cost reduction at 10 to 15% for organizations that move from reactive staffing to proactive capacity planning.
The 2026 definition has shifted from what it described ten years ago. Workforce optimization no longer refers to headcount freezes and cost-cutting exercises that HR implements during financial emergencies. It has become the architecture through which HR, Finance, and Operations connect people decisions to business performance: aligning hiring plans with revenue forecasts, linking role definitions to capability requirements, and using real-time data to close the gap between what the workforce is doing and what the business needs it to do.
This guide covers the full picture: what workforce optimization involves, the five strategies that produce measurable results, the KPIs that distinguish genuine optimization from activity, the tools available by organizational tier, how INOP’s BBRA decision framework structures the core workforce investment decisions, and how AI and automation are reshaping what optimization looks like in practice.
Want to see workforce optimization connected to financial scenario modeling? Book a 20-minute demo with INOP.
What Is Workforce Optimization
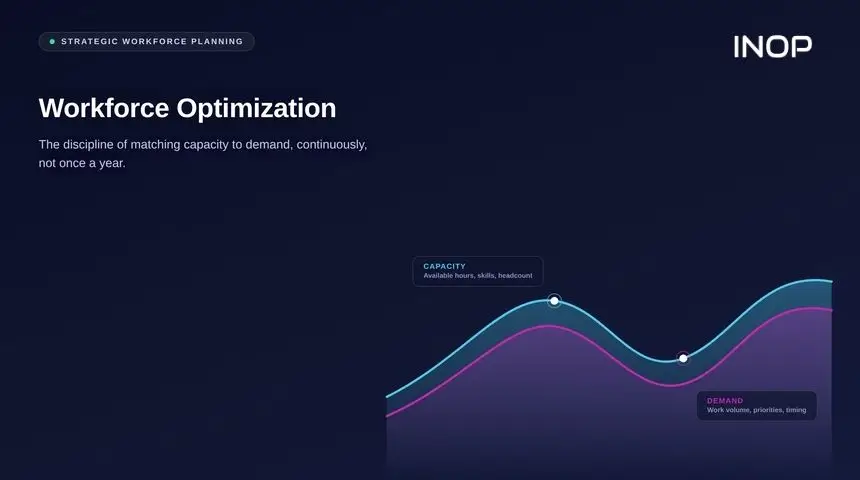
Workforce optimization (WFO) is the discipline of ensuring the right people are doing the right work at the right cost, and that the data to verify all three of those conditions is current and trusted. It covers workforce planning, scheduling efficiency, skills gap management, performance management, and the automation of tasks that no longer require human judgment at the frequency they previously did.
The distinction between workforce optimization and workforce management matters. Workforce management handles the operational layer: scheduling, time tracking, absence management, and compliance. Workforce optimization operates above that layer, using the data management systems produce to make strategic decisions about staffing levels, capability investment, deployment, and automation. Resource Group Holdings’ 2026 guide frames this directly: unlike traditional workforce management, which focuses on basic scheduling and time-tracking, modern WFO uses artificial intelligence to achieve predictive planning and global agility.
Workforce Optimization vs. Workforce Planning
Workforce planning asks: what people do we need over the next 12 to 36 months? Workforce optimization asks: are the people we have now deployed, developed, and incentivized in a way that produces the results we need? Planning is forward-looking. Optimization is present-state. Both are necessary, and neither substitutes for the other. An organization with a rigorous workforce plan that has never examined whether its current workforce is operating at capacity is planning for a future it has not optimized toward. An organization that optimizes its current workforce without a plan is improving execution of a strategy that may already be misaligned.
For a complete treatment of workforce planning methodology, INOP’s guide on modern workforce forecasting covers how predictive planning connects to the optimization decisions described in this article.
Why Workforce Optimization Has Become Urgent in 2026
Three forces are making workforce optimization a priority for organizations that treated it as optional five years ago.
The first is AI adoption at pace. By early 2025, 75% of knowledge workers were already using AI tools at work, with daily users reporting productivity gains of 64%, improved focus in 58% of cases, and higher job satisfaction in 81% of cases, according to TechRadar research cited by Resource Group Holdings. AI adoption at this scale changes what workforce optimization means: the question is no longer whether to automate but which tasks to automate, in what sequence, and how to redeploy the human capacity that automation releases.
The second is the engagement decline. Hivemind’s 2026 Complete Guide to Workforce Optimization reports that retention and engagement rank among the top three priorities for 61% of HR professionals, while employee engagement has dropped to 64%, down from prior years. Disengaged employees represent a specific and quantifiable productivity loss: Gallup research consistently shows that disengaged employees produce 18% less output than engaged peers at the same role level. Workforce optimization that ignores engagement as a productivity variable is optimizing the structure while the fuel level drops.
The third is the skills gap acceleration. The World Economic Forum’s 2025 Future of Jobs Report projects that 59% of workers need upskilling or reskilling by 2030. An organization that has not mapped the delta between what its workforce can do today and what its business plan requires them to do in three years is making workforce investment decisions without the data to evaluate them. For a full treatment of how skill gaps affect strategic execution, INOP’s guide on closing skill gaps for strategic workforce planning covers the identification and closure methodology in depth.
Five Workforce Optimization Strategies That Produce Measurable Results
Strategy 1: Shift From Headcount Planning to Capability Planning
Most organizations plan their workforce in headcount numbers by function and level. This produces a plan that Finance can budget and HR can recruit against, but it answers the wrong question. Headcount tells you how many people you have. Capability planning tells you whether those people can execute the business strategy.
The practical shift requires three changes. First, build a skills taxonomy for the roles most critical to your strategic plan, with proficiency levels defined in behavioral terms rather than credential lists. Second, assess current capability against that taxonomy using multi-source data: self-assessment, manager validation, and objective assessment for technical skills where manager validation is insufficient. Third, connect the gap findings to the planning decisions that follow: where you hire, what you develop, which functions you restructure, and which tasks you automate.
Organizations that make this shift consistently report a finding that surprises them: a larger share of the capability gaps they assumed required external hiring can be addressed through internal redeployment than their headcount model suggested, because the headcount model was tracking titles rather than skills. The capability they needed was present in a different function, attached to a different job title, and invisible to the planning process until the skills data surfaced it.
Strategy 2: Build the Automation Layer Into the Workforce Model Explicitly
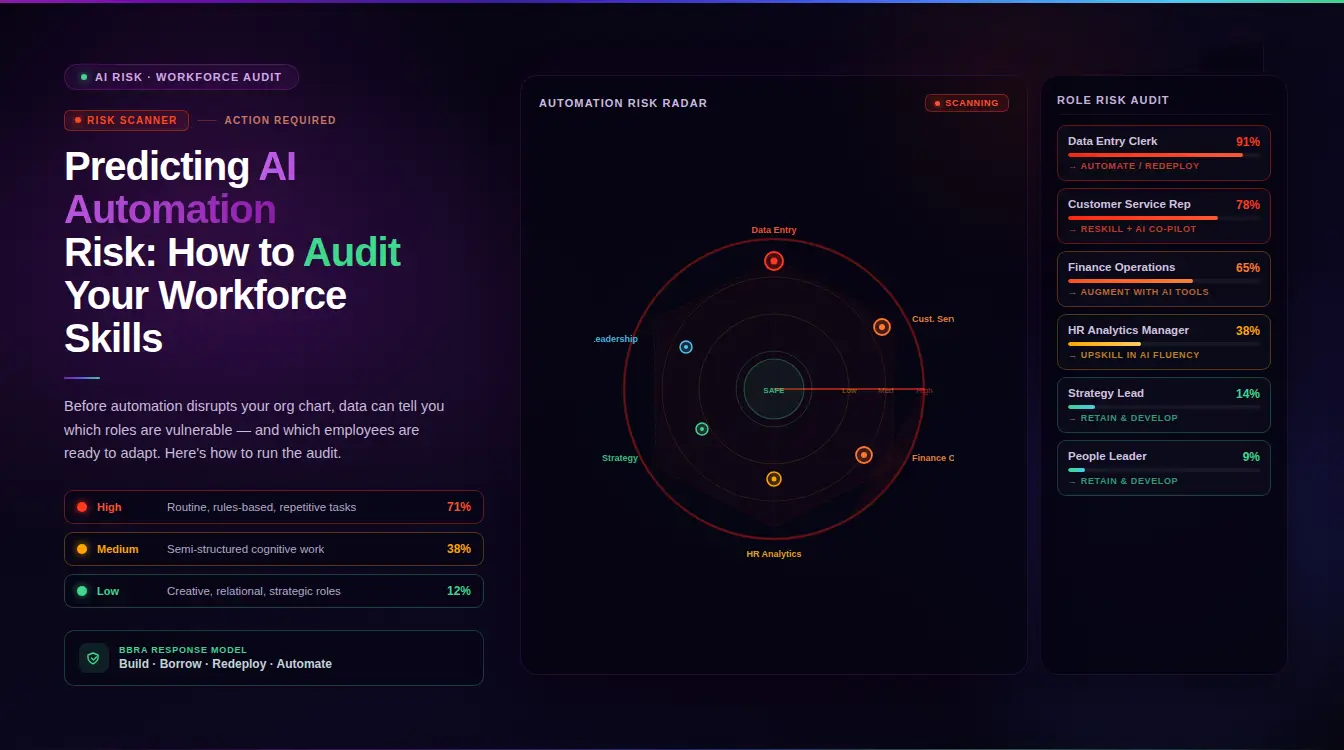
McKinsey’s 2025 research found that 28% of routine knowledge tasks are now automatable with current AI and software tools. For organizations that have not modeled this into their workforce plan, that figure represents a significant gap between the headcount the business thinks it needs and the headcount it actually needs.
The automation question in workforce optimization is not “will AI replace our workforce?” It is “which specific tasks within each role family are candidates for automation in the next 12, 18, and 36 months, and what does that do to headcount requirements and skills needs?” Answering this at the task level rather than the role level changes the planning conclusion. A data analyst role that currently spends 40% of its time pulling standard reports is not a role that gets eliminated by automation: it is a role where 40% of the current task composition automates, freeing that capacity for higher-order analytical work the role was previously too time-constrained to perform.
INOP’s AI and Automation intelligence lens models automation susceptibility at the task level across 40,000 or more roles, using seven research frameworks across six dimensions and four time horizons: 30 days, 180 days, one year, and three years. This is the analysis that converts “AI will affect our workforce” from a board-level concern into a specific, time-bound planning input that HR and Finance can act on together.
Strategy 3: Connect Scheduling and Deployment to Skills Data
Workforce scheduling in most organizations matches available bodies to open shifts or project slots. Workforce optimization matches verified capabilities to work requirements. The difference is the quality of the output at the point of assignment.
In operational environments with shift-based workforces, scheduling optimization using AI-powered demand forecasting tools reduces overstaffing and understaffing simultaneously. Organizations using machine learning to forecast demand against scheduling patterns report significant cost savings from reduced overtime and agency coverage costs, alongside improved customer satisfaction from more consistent staffing quality. Evolia’s 2026 workforce optimization analysis notes that combining historical scheduling demand with predicted future demand prevents workforce issues that harm both employee wellbeing and business results.
In knowledge-work and project-based environments, the equivalent optimization is project staffing based on skills matching rather than availability and seniority. An employee matched to a project based on their verified skills proximity to the project requirements reaches productive output faster, requires less support from senior team members, and produces higher-quality work than an employee assigned because they had calendar availability. INOP’s skills intelligence platform maps verified internal capability against external market demand signals across four states: Emerging, In Demand, Stable, and Declining, providing the capability visibility that makes skills-based deployment decisions reliable rather than aspirational.
Strategy 4: Use Performance Data to Drive Development Investment, Not Just Ratings
Performance management in most organizations produces annual ratings that feed compensation decisions and, in some cases, dismissal processes. Workforce optimization uses performance data differently: as a signal that identifies where training investment will produce the highest productivity return, where capability is accumulating in concentrations that create key-person risk, and where engagement decline is predicting near-term attrition before it shows up in turnover statistics.
Asanify’s 2026 workforce optimization guide identifies the link directly: using performance data to identify skill gaps early and rewarding high performers through structured compensation models are two of the core practices that distinguish organizations with scalable workforce systems from those where performance management is a compliance exercise. The first connects performance data to development investment. The second connects performance data to compensation decisions.
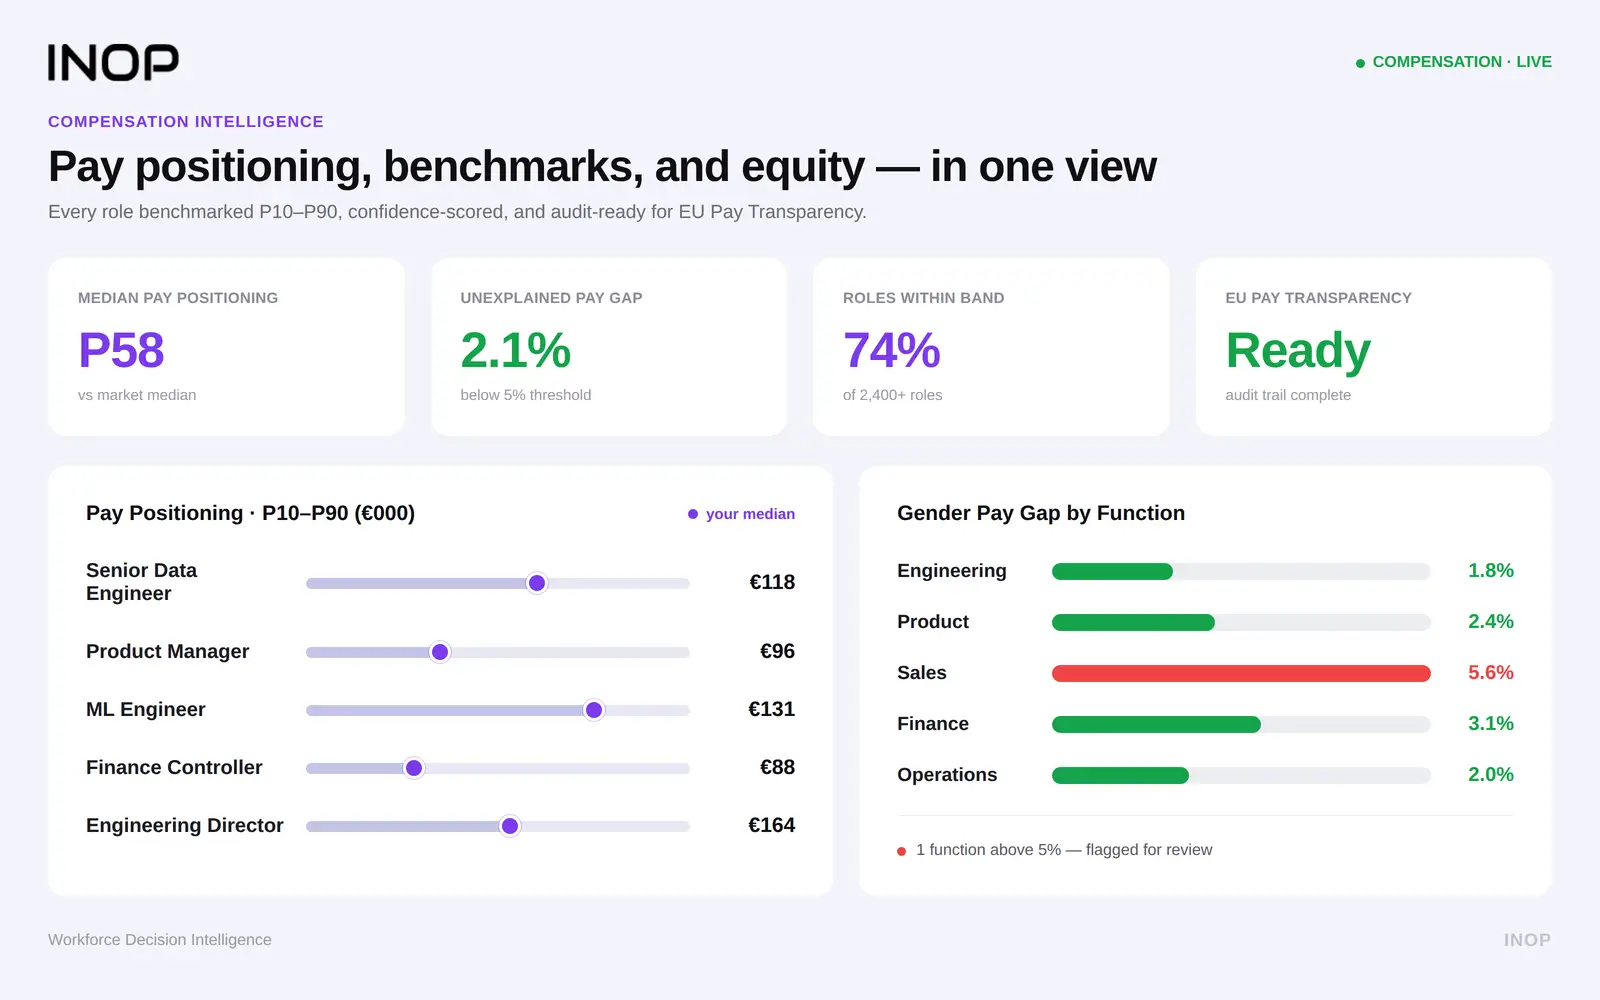
The connection to compensation is where workforce optimization and compensation analytics intersect most directly. An organization whose performance management data identifies that its highest-productivity employees are paid at the 42nd market percentile is operating a retention risk that workforce optimization cannot solve through scheduling or skills investment alone. The performance data diagnoses the problem. The compensation analytics provides the market context to address it.
Strategy 5: Align Workforce Decisions Across HR, Finance, and Operations Through Shared Data
Asanify’s 2026 analysis identifies fragmented data systems as one of the primary barriers to workforce optimization at scale: many companies operate with separate systems for payroll, attendance, performance, and recruitment, and manual reconciliation between HR and Finance becomes routine. Attendance data does not sync with payroll. Performance data does not inform scheduling. Headcount decisions do not reference skills inventory.
The optimization gain from resolving this fragmentation is not primarily technological. It is decisional. HR, Finance, and Operations making workforce decisions from different data with different update cadences will reach different conclusions about the same workforce situation. An HR leader looking at attrition data sees a retention problem. A Finance leader looking at headcount cost sees budget performance. An Operations leader looking at delivery capacity sees a resourcing gap. All three are looking at consequences of the same upstream decision failure: a workforce plan built on shared assumptions would have identified the risk before it manifested as three separate problems in three separate dashboards.
INOP’s strategic workforce planning platform is built specifically for this integration challenge, connecting workforce decisions across five intelligence lenses: Strategy, Finance, People, Market, and AI and Automation. These five lenses ensure that a headcount decision that makes sense on the HR dashboard is also evaluated against its financial implications, market capability signals, and automation context before it is executed rather than after.
The BBRA Framework: INOP’s Decision Architecture for Workforce Optimization
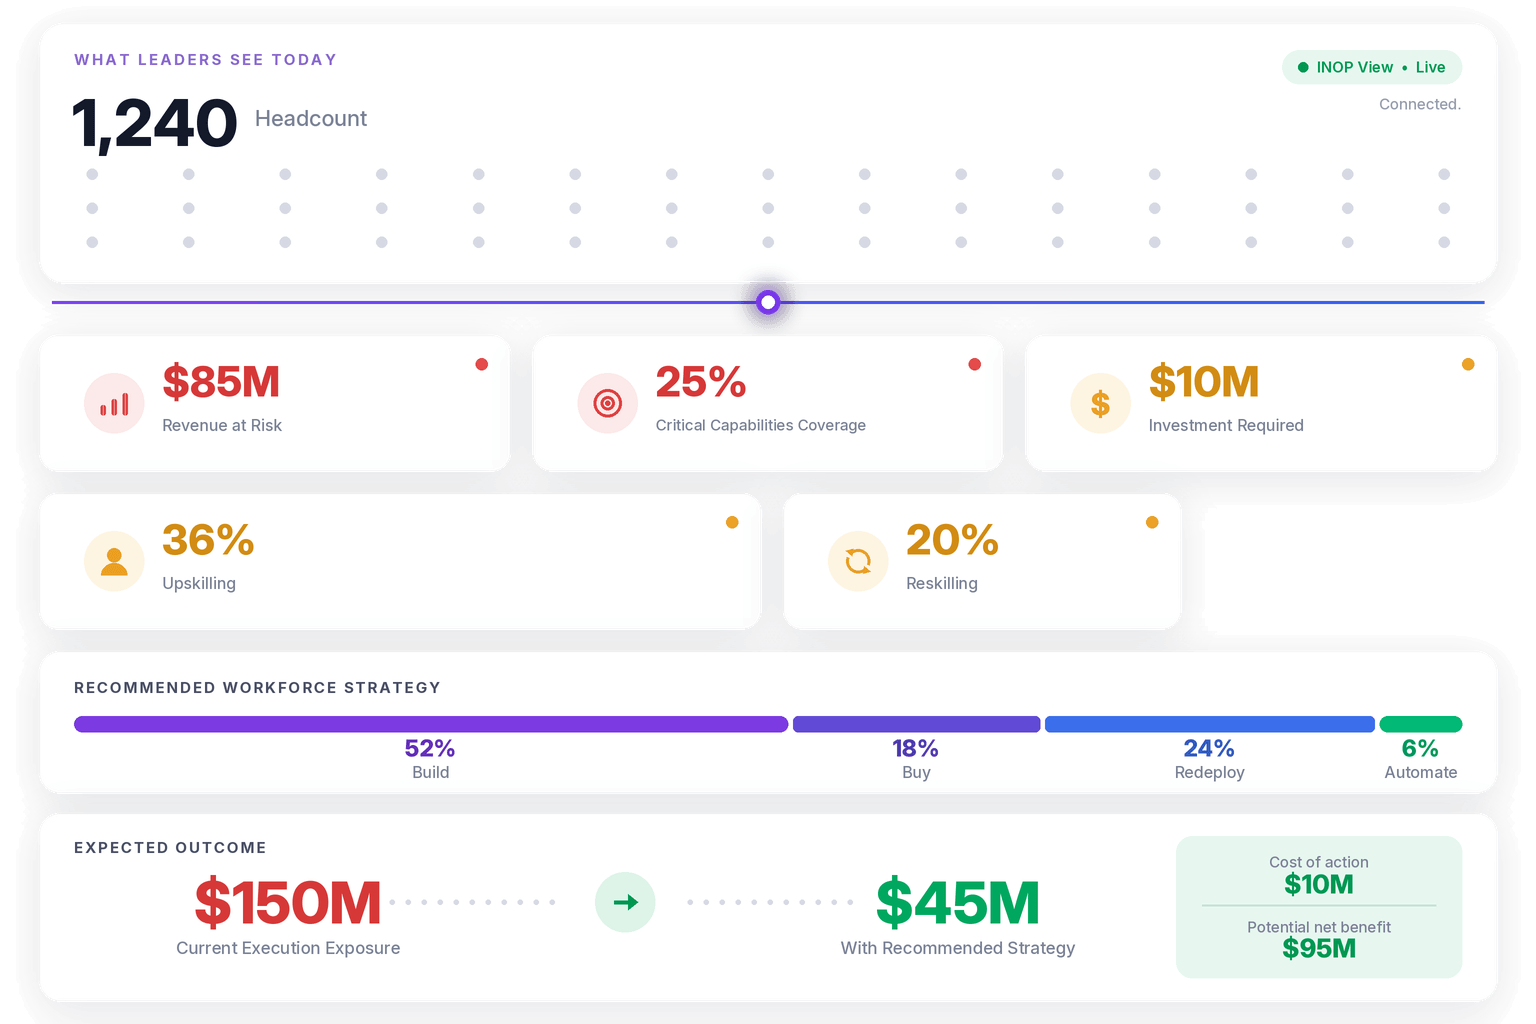
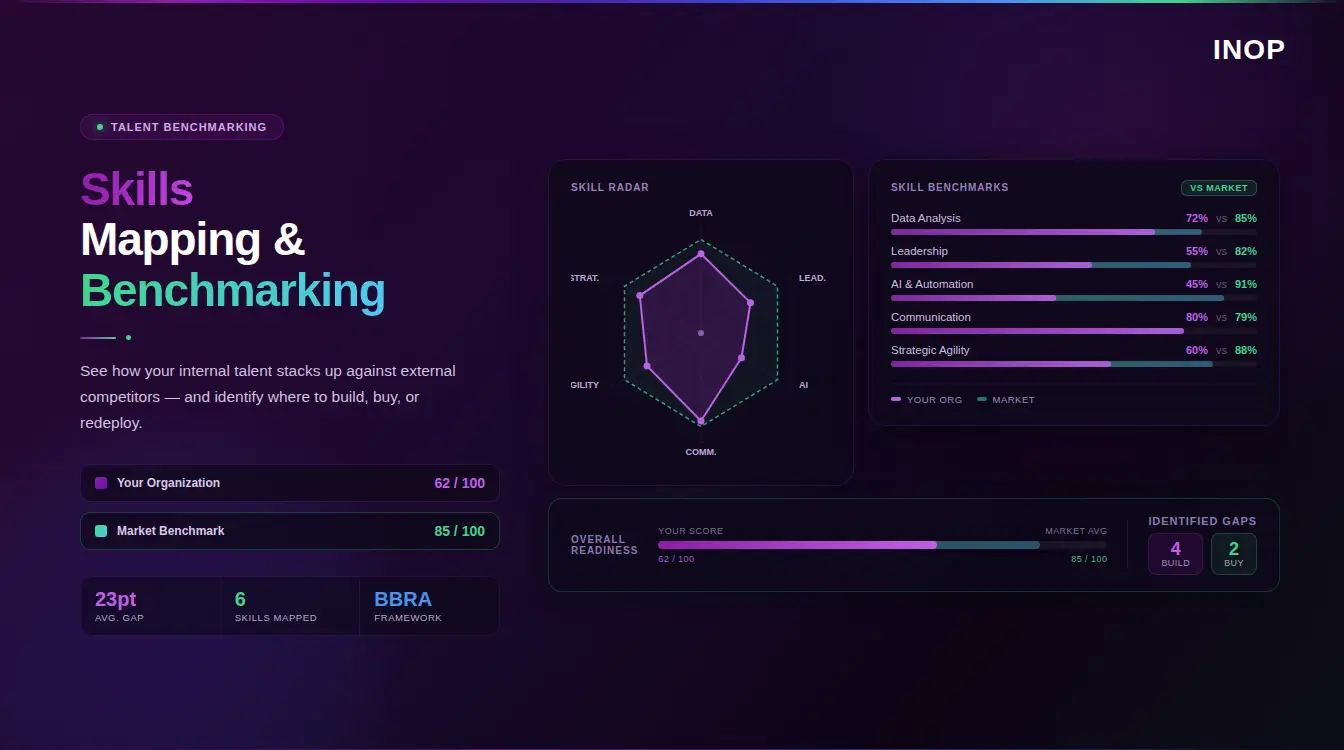
Every workforce optimization decision eventually reaches the same fork: you have identified a gap between what your workforce can do and what the business needs. Now what? INOP’s proprietary BBRA framework, Build, Buy, Redeploy, Automate, provides the structured decision architecture that converts a gap finding into a specific, financially evaluated course of action across four time horizons: 30 days, 180 days, one year, and three years.
Build develops the capability internally through training, structured reskilling, stretch assignments, or mentoring. The evaluation question is whether the required proficiency can be developed within the timeline the business needs it. A cloud architecture gap needed in four months cannot be built in four months. The same gap on an 18-month horizon usually can be, at lower total cost than external hiring and with higher retention probability because the employee experiences the development as career investment.
Buy acquires the capability through external hiring. The financial evaluation should include time-to-fill for this role family in this geography, the ramp period before the hire reaches full productivity, agency or recruiter fees where applicable, and compensation cost modeled against current market data rather than internal bands set at the last compensation review. These four figures together almost always produce a number substantially higher than the base salary figure that appears in the headcount plan.
Redeploy moves an internal employee with adjacent skills into the gap. The Redeploy pathway closes gaps faster and at lower cost than external search for roles where ramp time on an external hire is long, because the redeployed employee already understands the organization, the context, and the systems. It requires a verified skills inventory to identify who has the adjacent capability. Without skills data, Redeploy is a pathway that exists on paper but gets skipped in practice because the data to execute it does not exist.
Automate evaluates whether the work can be handled by AI tools or process automation, removing the human capacity requirement. For McKinsey’s 28% of routine knowledge tasks that are now automatable, the Automate pathway produces the highest financial return of the four options: the gap closes with no hiring cost, no development investment, and no ramp time. The evaluation question is whether the current automation tooling is reliable enough to meet the required quality standard and whether the humans previously performing the automated tasks can be redeployed toward higher-value work rather than simply reduced.
The BBRA framework is not a sequential checklist where you evaluate Build before Buy. It is a parallel financial comparison: model all four pathways against the required timeline and total cost, then select the pathway that closes the gap at the lowest risk-adjusted cost within the available window. For organizations where workforce decisions need to be presented to Finance or a board as capital allocation choices rather than HR recommendations, this structure produces the financial comparability those audiences require.
Workforce Optimization KPIs: Measuring Whether It Is Working
Workforce optimization produces measurable outcomes. If your current KPI set does not change when optimization improves, you are measuring the wrong things.
Revenue per employee is the primary productivity KPI that connects workforce optimization to business performance in the language Finance and boards understand. Track it quarterly by function, not just company-wide. A company-wide revenue per employee figure that holds steady while the engineering function’s figure declines and the sales function’s rises is hiding two different problems under one aggregate number.
Internal fill rate measures what percentage of open roles and projects were filled by internal candidates surfaced through skills matching rather than external search. An internal fill rate below 20% in an organization that has invested in a skills inventory suggests the redeployment pathway is being systematically skipped, either because managers are not using the skills data or because the data is not trusted. Target 30 to 40% or above for organizations with mature skills inventories.
Time to productivity for new hires and redeployed employees measures how long it takes someone to reach the output level the workforce plan assumed. Organizations that track time-to-fill but not time-to-productivity consistently overstate near-term capacity and understate the real cost of workforce gaps. An engineering team that hired six people in Q1 with a three-month average ramp period is operating at approximately 75% of planned capacity through Q2 regardless of what the headcount report shows.
Skills coverage rate measures the percentage of employees who meet the required proficiency standard for their current role’s critical skills. Below 60% coverage in a function directly responsible for strategic delivery is a risk that should appear in the CHRO’s board update, not only in the L&D department’s training completion report. According to research cited by Parim Workforce Software, organizations that systematically track skills coverage against role requirements identify development gaps months before those gaps affect delivery timelines.
Attrition in high-value roles tracked separately from company-wide attrition. A blended 14% attrition rate that includes 28% in engineering and 8% in operations requires different interventions in each function. The blended number produces neither insight nor action. The segmented number identifies exactly where workforce optimization investment will produce the highest retention return.
Automation adoption rate measures what percentage of the tasks identified as automatable in the BBRA analysis have been successfully transitioned to automated workflows. This KPI is new for most organizations in 2026 but will become standard as AI adoption matures. An organization that identifies 28% of routine tasks as automatable but has transitioned only 6% of them has an execution gap in its optimization programme that does not show up in any traditional HR metric.
Workforce cost as a percentage of revenue tracks whether headcount investment is growing proportionately to the business value it produces. This figure needs to be evaluated alongside revenue per employee rather than in isolation: a workforce cost percentage that declines because a company reduced headcount aggressively may look like optimization on the cost side while productivity per remaining employee also declines, which is the opposite of optimization.
Workforce Optimization Tools: A 2026 Comparison by Use Case
The workforce optimization tool market has expanded significantly in 2026, and choosing the wrong category of tool for your primary use case is a reliable way to produce an expensive implementation that does not change decisions. The market divides into four categories based on what problem each primarily solves.
Workforce Management Platforms
These platforms handle the operational layer: scheduling, time tracking, absence management, and demand-based staffing. Kronos (now UKG), Deputy, and When I Work serve this category. They are the right tool when the primary optimization challenge is operational: reducing overtime costs, eliminating scheduling gaps, improving shift coverage, or connecting staffing levels to demand signals in retail, healthcare, hospitality, or logistics environments.
The limitation of workforce management platforms for strategic workforce optimization is their operational scope. They optimize for the next shift, not for the next 18 months. An organization whose primary challenge is skills coverage, succession risk, or capability alignment for a three-year strategic plan needs a different category of tool.
People Analytics Platforms
These platforms connect HR data sources into analytical insights about workforce performance, attrition risk, and organizational effectiveness. Visier, OneModel, and Crunchr serve this category. They are the right tool when the primary challenge is understanding what is happening in the workforce: which employees are at attrition risk, where performance is declining, which management behaviors predict team outcomes.
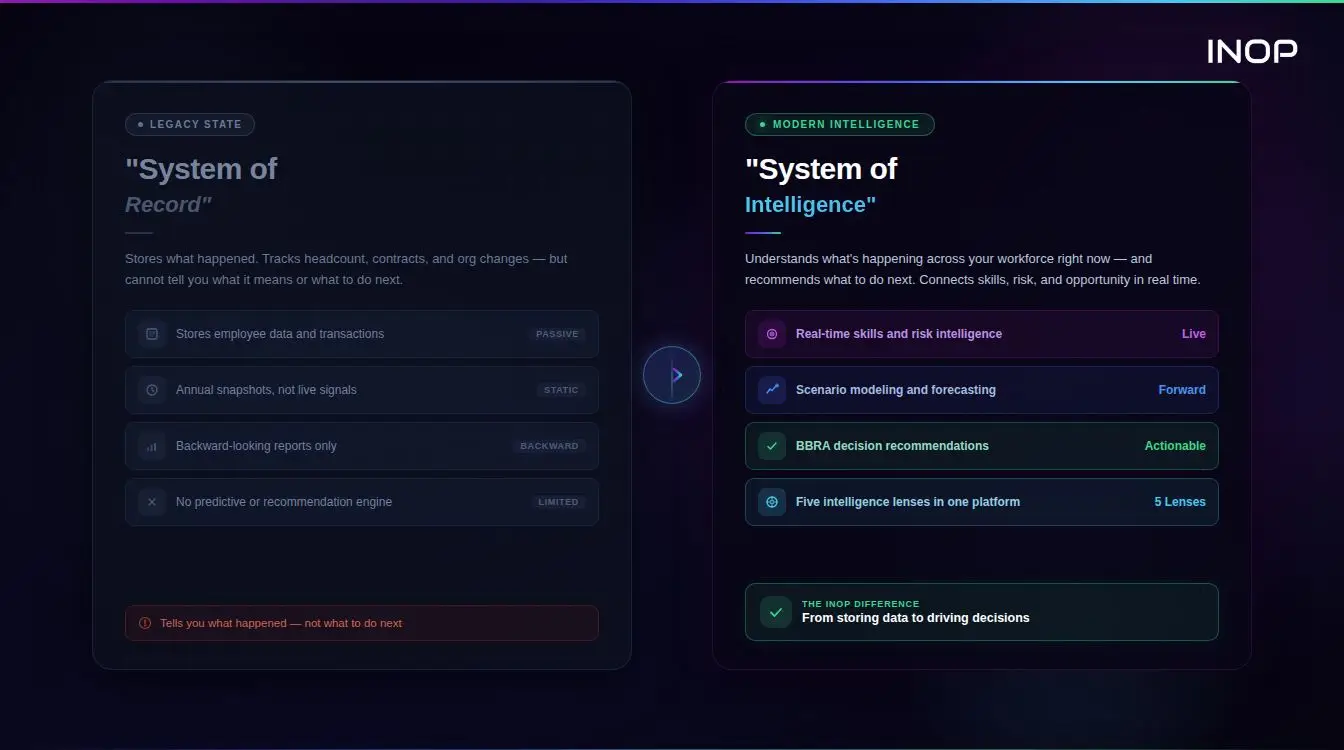
People analytics platforms produce insights. They do not produce the BBRA-structured financial decision that translates an insight into an approved capital allocation. An organization that knows 22 critical employees are at elevated attrition risk still needs to evaluate whether retention investment, compensation adjustment, internal redeployment, or replacement hiring is the right response for each individual case, and what each option costs against each other over the relevant time horizon.
Skills Intelligence and Workforce Decision Platforms
These platforms connect skills assessment data to strategic planning decisions, connecting the “what is happening” of people analytics to the “what should we do about it” of the BBRA decision framework. INOP’s platform sits in this category, alongside platforms like Eightfold AI, Gloat, and 365Talents which focus on specific dimensions of skills intelligence and internal mobility.
The distinction between skills intelligence platforms is what each one connects its skills data to. Platforms focused on internal mobility connect skills data to opportunity matching. Platforms focused on L&D connect skills data to learning pathways. INOP connects skills data to financial scenario modeling across BBRA pathways, so the gap analysis produces a capital allocation decision rather than an HR recommendation. That output format is the one that earns Finance and board engagement with workforce optimization data.
HRIS Platforms With Optimization Modules
Workday, SAP SuccessFactors, and Oracle HCM all offer built-in optimization capabilities: skills tagging, performance management, succession planning, and analytics modules. These are appropriate when the organization’s data is already centralized in one of these platforms and the optimization use case can be served by the module’s depth. The common limitation is that module depth rarely matches the specialist platforms in any specific category: the skills module is less sophisticated than INOP, the analytics module is less sophisticated than Visier, and the scheduling module is less sophisticated than UKG.
Workforce Optimization and AI: The 2026 Inflection Point
The Asanify 2026 analysis describes the shift precisely: workforce optimization without technology is largely theoretical, and the moment headcount crosses a certain threshold, manual coordination begins to erode efficiency. In 2026, that technology layer increasingly means AI, and the ways AI contributes to workforce optimization have multiplied in the last 24 months.
Predictive attrition modeling identifies employees at elevated departure risk 60 to 90 days before departure intent becomes departure action, giving HR time to intervene with targeted retention rather than replacement hiring. Skills inference tools build probabilistic skills profiles from work activity, project assignments, and learning completions, reducing the data collection burden for organizations trying to build their skills inventory at scale. Demand forecasting in scheduling environments uses machine learning to combine historical patterns with predicted future demand, eliminating the manual schedule-building process that consumes significant management time in shift-based workforces. And generative AI tools are beginning to automate the routine cognitive tasks within knowledge-work roles that McKinsey identified as the 28% of work now automatable.
The governance implication of AI in workforce optimization is worth naming directly. AI tools that influence workforce decisions, including scheduling algorithms that determine shift assignments, performance scoring tools that affect pay reviews, and attrition models that identify individuals for retention intervention, are subject to the same bias audit requirements that apply to AI employment decision tools under NYC Local Law 144 and emerging EU AI Act provisions. Organizations deploying AI in workforce optimization need to verify that their tools can produce explainable outputs, have been audited for adverse impact across protected groups, and allow human override of automated recommendations. For a full treatment of AI governance in workforce decisions, INOP’s guide on AI automation bias and workforce decisions covers the regulatory and governance landscape.
Underneath all four of these AI contributions to workforce optimization is a question that most optimization frameworks do not ask directly: is the workforce itself ready to use, govern, and build trust in these tools? Only 23% of business leaders say their organization is fully prepared for AI, and that readiness gap determines whether AI-assisted scheduling, attrition modeling, and demand forecasting produce reliable decisions or outputs nobody acts on. INOP’s guide on building an AI enabled workforce covers what separates the organizations that have closed that gap from the 77% still working through it.
Real-World Workforce Optimization Examples
Accenture: Reskilling at the Scale of Optimization
Accenture’s decision to train more than 500,000 employees in generative AI skills is one of the largest documented workforce optimization programmes in practice. The programme did not emerge from a headcount reduction decision: it emerged from a capability gap analysis that identified a growing distance between what Accenture’s client-facing workforce could deliver and what clients would expect within 24 to 36 months as AI tools became standard in the professional services engagements Accenture performs.
The optimization logic was Build over Buy: the external market for AI-fluent professional services talent was competitive, expensive, and would have required displacing existing client relationships. Internal development at scale, combined with a structured learnvantage programme connecting skills development to deployment eligibility, produced a capability upgrade across the existing workforce rather than a workforce replacement. The KPI that validated the programme was not training completion rate. It was the percentage of client engagements where AI capability was deployed by the internal team rather than subcontracted externally.
A Manufacturing Company: Closing Trades Retirement Risk Through BBRA Analysis
A mid-sized manufacturer identified through workforce planning that 31% of its skilled trades workforce was projected to retire within four years, concentrated in electricians and machinists across two facilities. Fewer than 15% of employees under 35 held the qualifications to fill those roles at the required standard.
Running the gap through the BBRA framework produced three parallel cost models. Buy, through external hiring at current market rates for these specializations, cost $4.2 million over four years in search fees, premium wages, and extended ramp time. Build, through a cross-training programme and apprenticeship partnerships with regional trade schools, cost $520,000 and closed the gap within the retirement timeline. Automate produced a partial answer: three specific tasks within the electrician role were candidates for automation that would reduce the required headcount by four roles, changing the total gap from 28 positions to 24.
The manufacturer invested in both Build and Automate, avoided the Buy pathway, and documented a $3.7 million saving against the external hiring scenario. The workforce optimization programme produced the financial comparison. The BBRA framework structured the decision. The cost modeling made it a capital allocation choice the CFO could evaluate rather than an HR recommendation the CFO had to accept on faith.
Workforce Optimization for PE Portfolio Companies
For private equity operating partners, workforce optimization carries a specific and time-compressed financial implication that general enterprise frameworks do not fully address. The hold period is finite, the value creation plan is specific, and an unoptimized workforce compounds against a timeline where every quarter represents a meaningful share of the investment horizon.
The workforce optimization audit that produces the most value in PE contexts in the first 90 days covers three questions. First, which roles are performing tasks that automation could now handle, and what does the resulting headcount reduction or redeployment opportunity cost to execute versus the annual labor saving it produces? Second, where is critical capability concentrated in one or two individuals, and what is the financial risk if either departs before a successor is developed or the relevant knowledge is documented? Third, which functions are operating below productivity benchmarks for their role type, and is the root cause a skills gap that development can address, a deployment problem that internal redeployment can address, or a structural headcount problem that requires external action?
Each of these three questions produces a financial answer that belongs in the value creation plan alongside revenue projections and EBITDA targets. An operating partner who can present the investment committee with a workforce optimization analysis showing $2.1 million in automation savings available in year one, $800,000 in avoided replacement costs from targeted retention investment, and a skills coverage improvement programme that de-risks the three most execution-critical roles for the transformation plan is bringing human capital intelligence into the capital allocation conversation in terms the committee can evaluate.
For portfolio companies approaching exit, a documented workforce optimization capability with measurable outcomes, tracked KPIs, and a skills intelligence foundation, produces a human capital narrative that institutional buyers and their advisors can evaluate rather than discount. INOP’s strategic workforce planning platform supports operating partners in building this capability across portfolio companies, connecting the workforce optimization analysis to financial scenario modeling in the format that investment committees and buy-side advisors require. Book a demo to see how INOP approaches workforce optimization for PE portfolio environments.
Ready to connect workforce optimization decisions to financial outcomes your CFO will trust? See INOP’s workforce intelligence platform in a 20-minute demo.
Common Workforce Optimization Mistakes
Treating optimization as a cost reduction programme. Asanify’s 2026 analysis is direct on this point: the 2026 definition of workforce optimization no longer considers cost-cutting measures and headcount freezes that companies implement during emergency situations. Organizations that launch workforce optimization as a cost reduction initiative produce headcount cuts that reduce capacity without improving the ratio of value to labor cost. The goal is not fewer people. It is more output from the people you have, directed at the work that produces the highest business value.
Skipping the skills inventory and going straight to the tool. Workforce optimization platforms are only as useful as the skills and performance data feeding them. Organizations that select and deploy platforms before establishing a trusted skills taxonomy and assessment process consistently find their optimization outputs are not trusted by Finance or business leaders because the data foundation is unreliable. The skills audit before the platform selection is not a delay to the project. It is the project.
Optimizing for today’s task composition rather than tomorrow’s. A workforce that is optimally deployed for the current operating model will be misdeployed 18 months from now if the operating model is changing. AI adoption, market expansion, product pivots, and regulatory changes all alter what the workforce needs to do. Workforce optimization that does not incorporate the forward-looking automation and skills demand picture from INOP’s Five Intelligence Lenses is optimizing toward a point that is already moving.
Measuring inputs rather than outcomes. Training completion rates, hiring velocity, and headcount targets are inputs. Revenue per employee, internal fill rate, skills coverage rate, and productivity per function are outcomes. Organizations that measure only inputs can run a comprehensive workforce optimization programme that produces no measurable change in organizational performance, because none of their metrics connect the programme’s activities to business results.
Running HR and Finance workforce optimization models separately. Two separate analyses of the same workforce situation, built on different data sources and updated on different schedules, produce different conclusions that Finance and HR then spend the planning meeting reconciling rather than acting on. A single shared workforce data model, updated continuously and accessible to both functions, is the infrastructure on which workforce optimization decisions can be made rather than debated.
The structural reason this mistake is so common is that most redesign efforts are organized as projects with defined deliverables rather than as ongoing operating capabilities. INOP’s guide on workplace transformation strategy covers exactly why a transformation plan built around a defined end date produces a result that looks complete and drifts out of alignment with the business it was built to serve, often within the same planning cycle.
Frequently Asked Questions About Workforce Optimization
What is workforce optimization?
Workforce optimization (WFO) is the strategic process of aligning people, processes, and technology to maximize organizational productivity while controlling total labor costs. It covers workforce planning, skills gap management, performance management, scheduling efficiency, and the automation of tasks that no longer require human judgment at the frequency they previously did. The 2026 definition has evolved beyond cost-cutting: it describes the architecture through which HR, Finance, and Operations connect people decisions to business performance outcomes.
What is the difference between workforce optimization and workforce management?
Workforce management handles the operational layer: scheduling, time tracking, absence management, and compliance. It optimizes for the next shift or the next month. Workforce optimization operates above that layer, using the data management systems produce to make strategic decisions about capability investment, deployment, automation, and headcount planning over a 12 to 36 month horizon. Both are necessary. Workforce management without optimization produces an operationally efficient workforce misaligned to strategic requirements. Workforce optimization without management produces strategic clarity that breaks down at the point of daily execution.
What are the key workforce optimization strategies?
The five strategies that produce measurable results in 2026 are: shifting from headcount planning to capability planning, so the workforce plan measures skills rather than bodies; building the automation layer into the workforce model, so the 28% of knowledge tasks now automatable changes headcount requirements rather than being ignored; connecting scheduling and deployment to skills data rather than availability; using performance data to drive development investment toward the highest-return skills gaps rather than the most popular training catalogue options; and aligning HR, Finance, and Operations on a single shared workforce dataset so decisions across all three functions use the same numbers and assumptions.
What KPIs measure workforce optimization effectiveness?
The KPIs that connect workforce optimization to business outcomes rather than HR activity are: revenue per employee by function (not company-wide average), internal fill rate for roles and projects, time to productivity for new hires versus plan assumptions, skills coverage rate against required proficiency for strategic roles, attrition rate in high-value functions segmented from company-wide attrition, automation adoption rate against the tasks identified as candidates for automation, and workforce cost as a percentage of revenue tracked alongside productivity to distinguish genuine optimization from cost reduction.
What is the BBRA framework and how does it support workforce optimization?
BBRA is INOP’s proprietary decision architecture for evaluating how to close a workforce capability gap. Build develops the capability internally through training or reskilling. Buy acquires it externally through hiring. Redeploy moves an internal employee with adjacent skills into the gap. Automate removes the human dependency through technology. For each identified gap, INOP models all four pathways across four time horizons, 30 days, 180 days, one year, and three years, producing a financial comparison that converts a workforce capability gap from an HR problem into a capital allocation decision Finance and boards can evaluate. The framework prevents the default behavior that makes workforce optimization expensive: routing every gap straight to external hiring without evaluating the lower-cost alternatives that may close the same gap faster.
How does AI affect workforce optimization in 2026?
AI contributes to workforce optimization at four levels. Predictive attrition modeling identifies employees at elevated departure risk 60 to 90 days before departure, giving HR intervention time before replacement hiring becomes necessary. Skills inference builds probabilistic skills profiles from work activity, reducing the manual data collection burden. Demand forecasting in scheduling environments uses machine learning to eliminate manual shift-building processes. And generative AI tools are automating the 28% of routine cognitive tasks across knowledge-work functions identified by McKinsey’s research as candidates for automation. The governance implication: AI tools that influence workforce decisions require bias auditing, explainable outputs, and human override capability under emerging employment AI regulations.
Can workforce optimization work for small businesses?
Yes. The principles apply at any scale. For organizations under 100 employees, workforce optimization does not require a dedicated analytics platform or a people analytics team. It requires three things: an honest assessment of current capability against the work the business most needs done, a quarterly review of whether the headcount and skills mix still match the business plan, and a structured evaluation of the BBRA alternatives before any vacancy defaults to external hiring. The financial return from even this lightweight version of optimization, primarily from the internal mobility and automation decisions that prevent avoidable external hiring costs, is significant relative to the time investment required to run it.
What role does workforce optimization play for PE portfolio companies?
For private equity operating partners, workforce optimization in the first 90 days of ownership identifies three high-value findings: which tasks are automatable with current tooling and what that saves annually versus the implementation cost, where critical capability is concentrated in single individuals creating key-person risk to the value creation plan, and which functions are operating below productivity benchmarks for their role type with root causes that are either addressable through development or require structural action. Each finding produces a financial recommendation that belongs in the operating plan alongside revenue and cost targets, not in a separate HR workstream. Documented workforce optimization capability with measurable KPI outcomes also strengthens the human capital narrative for exit due diligence, where institutional buyers increasingly expect evidence of systematic workforce management rather than reactive headcount decisions.