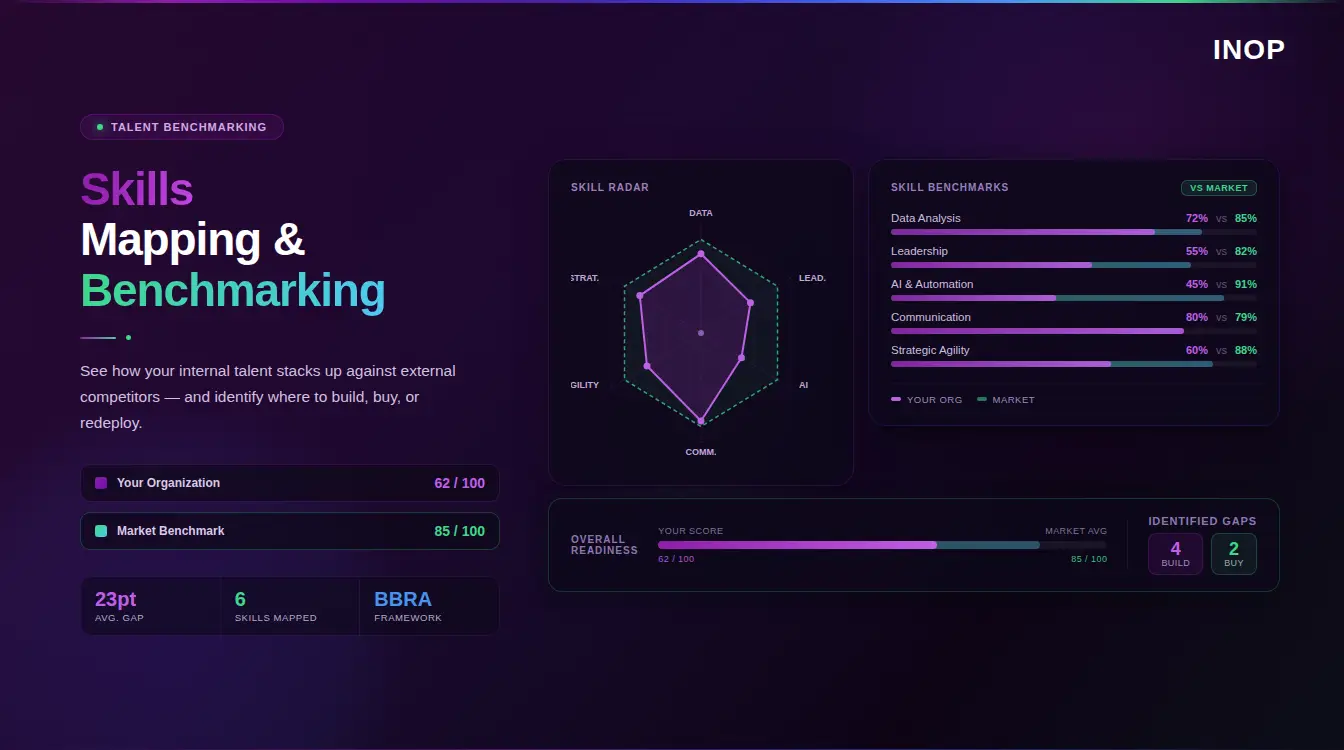
Add external benchmarking and the map also shows how your talent compares with competitors and the wider market. This guide explains what skills mapping is, how it differs from a skills inventory and a skills matrix, how to build a skills map step by step, a template you can use, how to benchmark skills against competitors and how to turn the gaps into decisions.
What Is Skills Mapping?
Skills mapping links three things: the skills each person holds, the skills each role requires and the skills the strategy will need. It answers practical questions such as which teams can deliver next year’s plan, who could move into a new role with a short development step, and which gaps put execution at risk.
Why Skills Mapping Matters Now
The World Economic Forum’s Future of Jobs Report 2025 found that 63 percent of employers see skill gaps as the biggest barrier to business transformation, that employers expect 39 percent of workers’ existing skill sets to be transformed or become outdated by 2030, and that if the world’s workforce were 100 people, 59 would need training by 2030.
Organizations are responding, but slowly. Mercer’s 2025/2026 Skills Snapshot Survey found that 38 percent of organizations have an enterprise-wide skills library, up from 30 percent in 2023, and 55 percent map skills to jobs, up from 47 percent.
The Cost of Skills Blindness
Without a skills map, leaders plan with headcount and job titles. They miss capability that already exists, spend on external talent for skills they could develop, fund training that does not match real gaps and find critical shortages only when delivery slips.
Skills Mapping vs Skills Inventory vs Skills Matrix
| Tool | What it is | Question it answers |
|---|---|---|
| Skills inventory | A list of the skills people hold | What skills do we have? |
| Skills matrix | A grid of people against skills, usually for one team | Who can do what, at which level, in this team? |
| Competency framework | The skills and behaviors expected in each role | What should people in this role be able to do? |
| Skills map | Supply compared with role and strategic demand, often benchmarked externally | Where are our gaps, and how do we compare with the market? |
An inventory is an input to a skills map, and a matrix is a team-level view of it. For the inventory, read skills inventory. For the role side, read competency mapping.
How to Build a Skills Map Step by Step
Define Your Skills Taxonomy
Agree on one list of skills with definitions and proficiency levels. Start with the skills tied to your strategy, and anchor them to a public reference such as the EU’s ESCO skills pillar or O*NET so your terms match the market. See how to build a skills taxonomy.
Collect Skills Data From Multiple Sources
Combine self-assessments with manager input, project and work records, learning histories, certifications and assessments. No single source is reliable on its own. See skill assessment tools.
Map Skills to Roles and Strategic Priorities
Define the skills and levels each role needs, then add the skills the strategy will need over the next two to three years. The gap between supply and both kinds of demand is what the map exists to show.
Verify Proficiency
Self-ratings drift with confidence. Verify the skills that drive decisions, such as those tied to pay, promotion or critical roles, with evidence.
Map Skills Adjacencies
Skills adjacency mapping shows which skills are close to each other, so you can see who could move into a new skill with a short development step. This is where redeployment and reskilling options come from.
Keep the Map Current
A skills map built once goes stale. Real-time skills mapping updates profiles as work, projects and learning are recorded. INOP’s skills intelligence infers and verifies skills from your existing data and keeps them current against market demand.
Skills Mapping Template
A practical skills map has three layers.
| Layer | What it holds | Example fields |
|---|---|---|
| Role profile | The skills and levels each role needs | Role, skill, required level, criticality |
| Individual record | Each person’s skills and levels with evidence | Person, skill, assessed level, evidence source, date |
| Organizational summary | Coverage and gaps by team and skill | Skill, people needed, people at level, coverage, gap |
Skills Mapping Example: One Row of the Summary
The figures are illustrative.
| Skill | Required level | People needed | People at level | Coverage | Adjacent holders |
|---|---|---|---|---|---|
| Machine learning engineering | Advanced | 10 | 4 | 40% | 6 data engineers at working level |
Coverage of 40 percent on a critical skill is a clear gap, but the six adjacent holders show that part of it could be closed by development rather than external sourcing.
Skills Benchmarking: Internal Talent vs External Competitors
A skills map shows your internal picture. Skills benchmarking adds the outside view: how your capability compares with competitors and the market.
What to Benchmark
- Skill mix: which skills competitors are building that you are not.
- Depth: how many people hold critical skills at advanced levels.
- Emerging skills: skills rising in market demand that are missing from your map.
- Pay for skills: what the market pays for scarce skills compared with your pay.
Where Benchmark Data Comes From
Competitors rarely publish their skills data, but you can infer a lot from job postings, public professional profiles, talent movement between companies, salary data and public skills frameworks. Treat the results as directional. For pay, INOP’s compensation analytics platform benchmarks pay by role and skill against real-time market data. See how to identify skills that deserve premium pay.
From Skills Gap to Decision
Classify Gaps by Urgency
| Small gap | Large gap | |
|---|---|---|
| Critical skill | Monitor and develop | Act now |
| Less critical skill | Accept | Plan over time |
Apply the BBRA Decision Framework
Each gap can be closed four ways: Build skills through development, Buy them from the market, Redeploy people with adjacent skills, or Automate part of the work. INOP’s BBRA decision architecture models all four pathways with financial trade-offs across 30-day, 180-day, one-year and three-year horizons, tested against five intelligence lenses: Strategy, Finance, People, Market, and AI and Automation. INOP’s strategic workforce planning platform connects the skills map to the workforce plan. For more on gaps, read what a skill gap is and reskilling vs upskilling.
See your skills map benchmarked against the market. INOP verifies skills, maps gaps and prices each way to close them. Book a demo
Skills Mapping Examples by Department
Data and Analytics Team
Map statistical modeling, data engineering, machine learning and stakeholder communication. Common findings are strong reporting skills, thin machine learning depth and data engineers who are adjacent to machine learning roles.
Sales Function
Map consultative selling, product knowledge, negotiation and use of sales data. Gaps often sit in data-driven selling and in knowledge of newer products.
HR Function
Map workforce analytics, change management, employee relations and HR technology. Many HR teams find strong operational skills and gaps in analytics and AI literacy. See AI skills gap analysis.
Skills Mapping Tools
Spreadsheets work for one team. At organization scale you need a platform that infers skills from data, verifies proficiency, maps adjacencies, benchmarks against the market and connects to planning and pay. Look for integration with your HRIS and learning systems and a clear audit trail. For comparisons, read top platforms for skills intelligence and skills-based workforce planning tools.
Common Skills Mapping Mistakes
- Relying only on self-assessment. Confidence is not proficiency.
- Mapping everything at once. Start with skills tied to strategy.
- Treating the map as a one-time project. Skills change. Refresh continuously.
- Ignoring the external view. An internal map without benchmarks hides competitive gaps.
- Not acting on the results. A map that does not change decisions loses support.
Connecting Skills Mapping to Learning
Close the loop by turning each person’s gap against their role or target role into a development plan, linking learning content to specific skills and updating the map when people complete assessed learning. That shows whether learning spend is closing the gaps that matter. For the planning connection, read using skills intelligence to drive strategic workforce planning.
Conclusion: Make the Skills Map Drive Decisions
Skills mapping gives leaders a clear view of the capability they have, the capability they need and how they compare with the market. Build it on a shared taxonomy, use several data sources, verify the skills that matter, map adjacencies and benchmark externally. Then turn each gap into a priced decision to build, buy, redeploy or automate.
Ready to map and benchmark your workforce skills? INOP links verified skills, market data and cost to priced decisions. Book a demo
Skills Mapping FAQs
What is skills mapping?
Skills mapping identifies the skills people have and at what level, and compares them with the skills roles and strategy need, showing strengths, gaps and options to close them.
What is the difference between skills mapping and a competency framework?
A competency framework defines what people in a role should be able to do. Skills mapping measures what people can do and compares it with that standard and with future needs.
What is the difference between a skills map and a skills matrix?
A skills matrix is a grid of people against skills, usually for one team. A skills map covers the whole organization, compares supply with demand and often adds external benchmarks.
How often should a skills map be updated?
Continuously where possible. Review critical skills quarterly and the wider map at least twice a year.
What role does AI play in skills mapping?
AI infers skills from work and learning data, maps adjacencies, matches profiles to market signals and flags skills losing relevance. People still validate the skills that drive decisions.
How can you benchmark skills against competitors who do not share data?
Use job postings, public professional profiles, talent movement, salary data and public skills frameworks, and treat the results as directional evidence.
Book a Demo
Make confident workforce decisions that support strategy and value creation.