Companies that build compensation decisions on real-time data rather than annual surveys outperform those that do not on every metric that matters to a CFO: lower voluntary turnover, better headcount forecast accuracy, and pay equity that survives audit. Payscale’s 2026 Compensation Best Practices Report, covering thousands of organizations globally, found that 45% of respondents are now advancing or optimizing their data-driven compensation approach, up 12 percentage points year-on-year. The gap between those organizations and the ones still running annual salary reviews against two-year-old survey data is widening.
This guide covers what a data-driven compensation strategy actually requires in 2026: a compensation philosophy as the foundation, real-time benchmarking as the data layer, pay equity automation as an ongoing discipline, the AI skills premium as a new benchmarking challenge, EU Pay Transparency compliance as a structural constraint, and predictive modeling as the tool that connects all of it to financial planning.
Why Traditional Compensation Models Break in 2026
Traditional pay structures relied on annual salary surveys, fixed bands adjusted by a flat percentage, and gut-feel calibration during merit review. The model worked when labor markets moved slowly, when roles were stable across years, and when employees lacked access to external pay data. None of those conditions still hold.
Employees in 2026 routinely arrive at salary negotiations with AI-generated market data specific to their role, location, and skill profile. Carta’s 2026 Comp Playbook identifies this as an “expectation gap”: candidates whose market research arrives in seconds expect your compensation data to be at least as current as theirs. An organization running on benchmarks from 14 months ago will lose offers to competitors whose data is current, and will not always know why.
The second structural failure is that annual reviews cannot track the pace at which AI and digital skills are changing market rates. A machine learning engineer’s market rate moved significantly between 2023 and 2025 as demand accelerated and as the skills required to hold that role became more specific. A compensation band set against 2023 data and adjusted by a standard 3% merit increase does not reflect this reality. For a treatment of how skills-based pay design addresses this specific problem, INOP’s guide on skills-based pay vs. job-based pay covers the structural differences in detail.
Start With a Compensation Philosophy, Not a Tool
The most consistent finding across current compensation research is that the organizations with the most effective data-driven pay strategies did not start by buying a platform. They started by writing a compensation philosophy: a document that defines what the organization intends to pay relative to the market, why, and how it will communicate that intent to employees and candidates.
A compensation philosophy answers four specific questions. Where does the organization want to position itself relative to the external market, at the 50th percentile as a standard competitive anchor, at the 75th to compete aggressively for specific skills, or below market with named compensating factors like equity, mission, or flexibility? How does the organization differentiate pay within the same role, by performance, by verified skills, by tenure, or by some combination? What counts as “the market” for each role family, geographic, industry-specific, or global? And what will the organization tell employees when they ask why they earn what they earn?
Without this document, data-driven compensation becomes data-informed inconsistency: different managers benchmark against different sources, apply different logic, and reach different conclusions for employees in equivalent roles. The technology amplifies the inconsistency rather than resolving it. SHRM’s guidance on making data-driven compensation decisions identifies compensation philosophy documentation as the prerequisite to any meaningful analytics investment.
Key Components of a Data-Driven Compensation Strategy
Real-Time Market Benchmarking
Salary surveys have a latency problem. Most major surveys collect data in the summer, publish in the autumn, and reach decision-makers in January, 14 months after the data was collected. In stable markets, that lag is manageable. In volatile ones, it produces compensation decisions calibrated to conditions that no longer exist.
Real-time benchmarking draws from live data sources: job posting aggregators that capture what employers are currently offering for specific roles in specific geographies, verified employee compensation databases, and recruiter fee and offer acceptance data that reflects current market clearing prices. The Connors Group’s 2026 compensation best practices guide recommends refreshing market data at minimum annually for stable roles and more frequently for roles in hot markets where demand is actively moving rates.
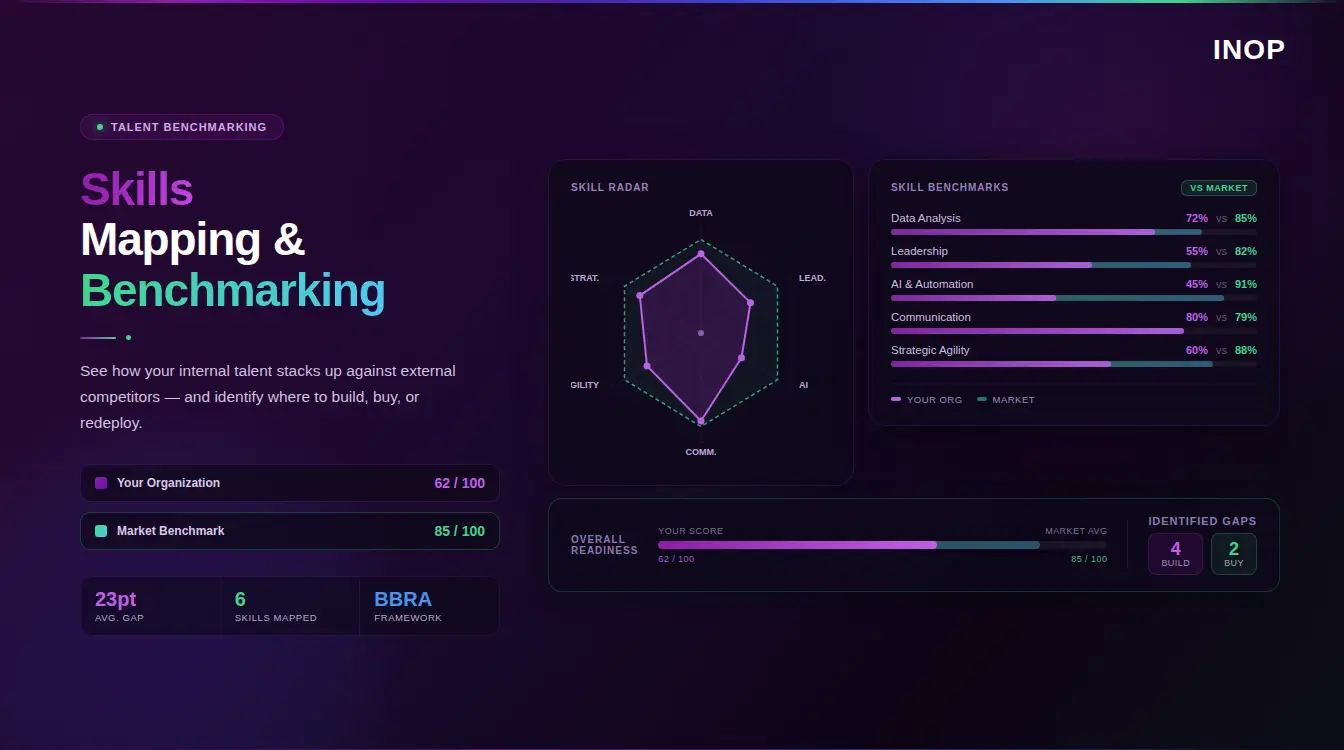
Benchmarking should operate at the skills level, not just the title level. Two people with the title “Senior Data Analyst” may have completely different market rates depending on whether they hold advanced Python, machine learning, or business intelligence capabilities alongside their analytical skills. A benchmark built on title alone conflates roles that the market prices very differently. For a complete treatment of how salary benchmarking with real-time data works in practice, INOP’s guide on how to benchmark salaries with real-time compensation data covers the seven-step process in detail.
The AI Skills Premium: The New Benchmarking Challenge
One of the defining compensation questions of 2026 is how to price AI skills when they appear in roles that traditionally did not require them. Carta’s 2026 Comp Playbook frames this as “hybrid roles where AI expertise and cross-functional skills are rewriting traditional job descriptions.” A marketing manager who builds and maintains AI-driven content workflows holds a different market value from a marketing manager who does not, even though the title is the same. A finance analyst who prompts and validates large language model outputs for reporting automation is a different role from one who does not, regardless of what the job architecture says.
Standard benchmarking approaches miss this because they benchmark titles rather than capability combinations. The practical consequence is systematic underpayment for the AI-capable variant of a role and systematic overpayment for the AI-limited variant, with neither correctly priced because the same compensation band covers both.
Addressing this requires two changes to how benchmarking works. First, the job architecture needs to distinguish between role variants by AI capability level, which most current architectures do not. Second, the benchmarking data needs to segment by AI proficiency, which requires data sources that capture this dimension rather than treating title as the primary differentiator. Organizations that solve this in 2026 will reduce offer failures on AI-capable roles and reduce overpayment on AI-limited ones simultaneously.
Pay Equity as an Ongoing Discipline, Not an Audit Event
Pay equity analysis in most organizations happens once a year, triggered by compliance deadlines or by a high-profile equity concern. CandorIQ’s research on data-driven pay equity tools identifies this cadence as one of the primary causes of equity gaps persisting despite organizations’ stated commitment to closing them: equity gaps that open during the year, from uneven merit increases, off-cycle adjustments, or new hire offers above band, stay open until the next annual audit finds them.
SHRM recommends building equity checkpoints into compensation cycle workflows rather than treating equity analysis as a one-off audit. Automated equity scanning after each merit cycle, after each cohort of new hire offers, and after each round of promotions catches gaps when they are small and before they compound. A 2% pay gap discovered in March is a correctable line item. The same gap discovered in December, after nine months of compound divergence across a dozen decisions, is an HR and legal exposure.
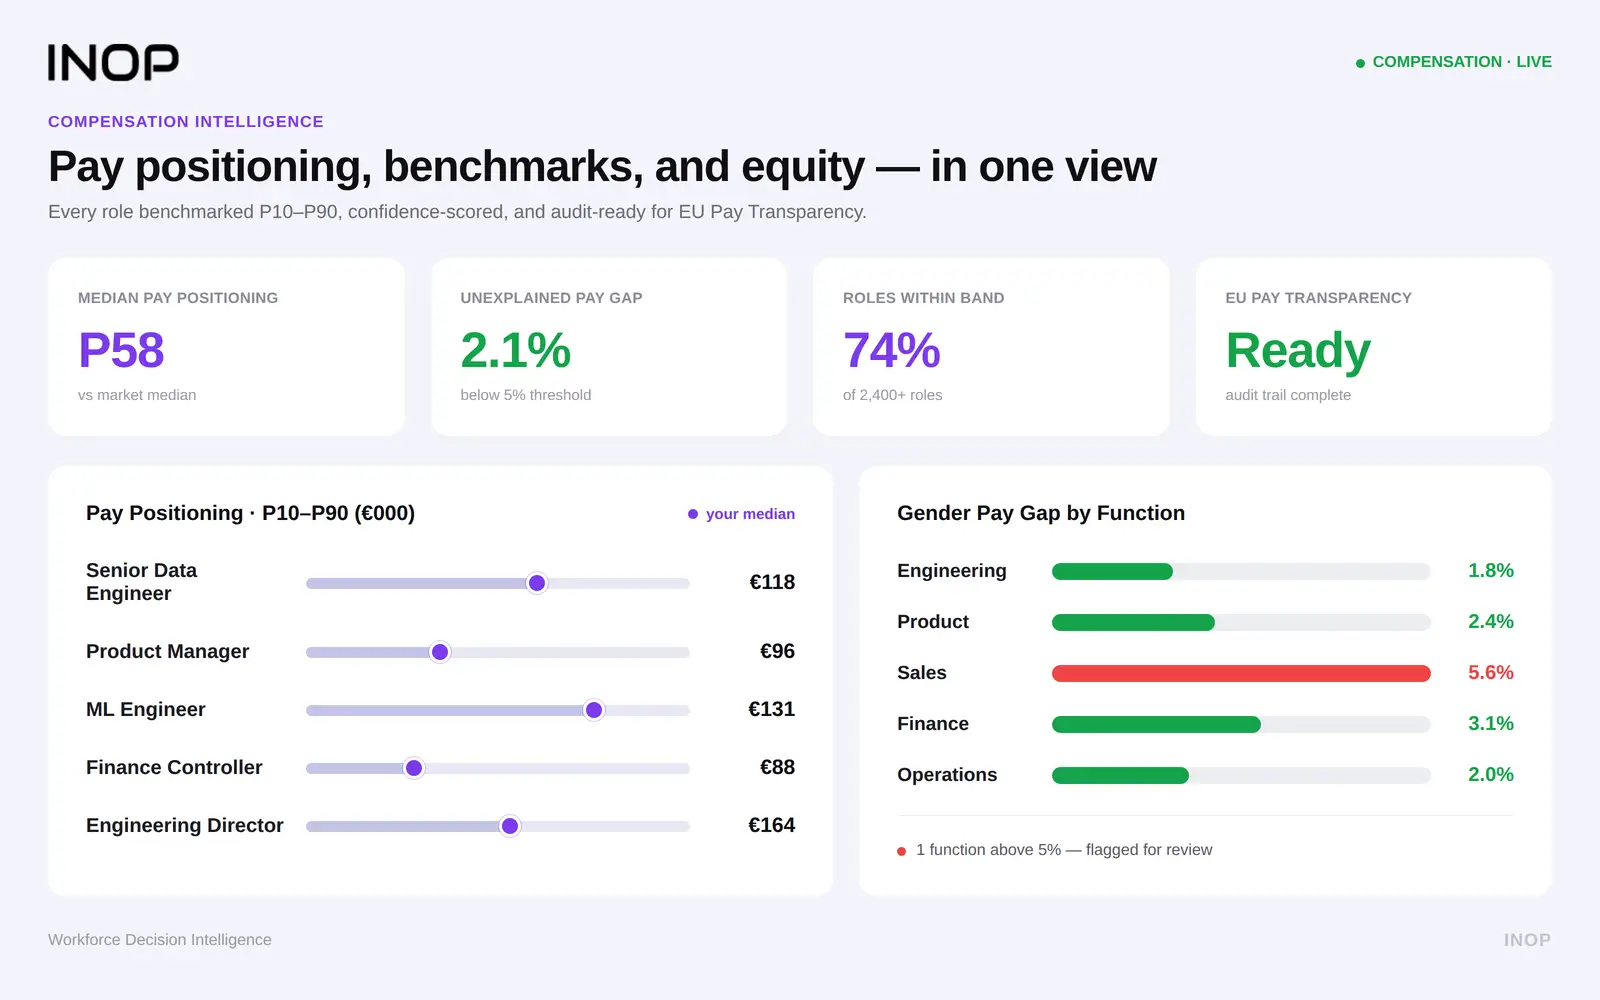
The analysis should segment across the dimensions where gaps most commonly appear: gender, ethnicity, tenure band, and performance rating, at the role family and level, not just company-wide. A company-wide gender pay gap of 1.8% can hide an 11% gap in one function that cancels out against a reverse gap in another. The aggregate figure satisfies no regulator and addresses no actual employee. For a deeper treatment of pay parity methodology and how internal and external salary parity connect, INOP’s guide on pay parity meaning covers the analytical framework in full.
Performance-Pay Integration
Linking pay to performance sounds straightforward. In practice it requires three design decisions that most organizations underspecify. Which performance data feeds compensation decisions, and at what cadence? How does performance positioning interact with market positioning when the two conflict — for example, a top performer in a role where the entire band is below market? And what does “merit increase” mean when some employees are already above the market midpoint and others are below it?
Leading organizations in 2026 use continuous performance scoring, updated at least quarterly, to calibrate where an individual sits within their band relative to both their performance level and their market position. An employee in the 90th percentile of performance but the 45th percentile of their market range has a different pay priority from one in the 90th percentile of performance who is already at the 80th percentile of market. Treating both with the same merit increase percentage either wastes budget or fails to close the retention risk that the first employee represents.
The relationship between pay compression and performance-pay integration deserves specific attention. When new hire offers are made at current market rates but existing employee salaries trail those rates because annual merit increases have not kept pace, high-tenure performers often earn less than recently hired peers in equivalent roles. Automated pay analysis surfaces this compression before it becomes the exit interview explanation for a valued employee’s departure. For a detailed guide on identifying and addressing pay compression through salary band design, INOP’s article on building skills-based pay bands covers the construction methodology that prevents this problem by design.
Predictive Compensation Modeling
Predictive modeling in compensation connects pay decisions to financial outcomes before they happen rather than explaining them after. The practical applications fall into three categories.
Budget scenario modeling simulates the total compensation cost impact of different merit increase strategies, hiring plans, and equity correction programmes before Finance locks the budget. An organization that models three scenarios, a conservative 2.5% merit increase, a market-aligned 3.5%, and a targeted 5% for flight-risk roles, before the budget cycle closes makes the trade-off decision with cost data rather than in the negotiation. Organizations using this approach reduce salary budget variance significantly, according to SHRM’s compensation analytics research.
Retention risk modeling combines compensation market position with engagement signals and tenure data to identify employees whose pay has drifted below market and who are showing early departure signals. This allows targeted retention investment before the departure decision rather than replacement investment after it. An employee at the 38th market percentile with declining engagement scores and 18 months without a promotion is a predictable attrition risk. Without the compensation and people data connected, that pattern is invisible until the resignation.
Offer optimization modeling uses historical offer acceptance and rejection data, segmented by role, level, geography, and competing offer source, to calibrate offer ranges that close the target candidate without overpaying relative to internal equity. For a complete treatment of how predictive analytics applies specifically to compensation forecasting, INOP’s guide on predictive compensation analytics covers the models and their applications in depth.
EU Pay Transparency Directive: The Compliance Layer That Changes Everything
EU member states were required to transpose the EU Pay Transparency Directive into national law by June 2026. For any organization with employees in EU jurisdictions, compliance obligations are now operational. For organizations operating globally, the Directive’s requirements are shaping best practice even where they do not yet legally apply.
The Directive’s most operationally significant requirements connect directly to data-driven compensation infrastructure. Organizations with 250 or more employees must report gender pay gaps annually, disaggregated by job category, showing mean and median gaps and pay distributions by gender at each level. The 5% threshold provision requires that any gender pay gap in a job category exceeding 5% that cannot be justified by objective criteria triggers a mandatory joint pay assessment and remediation plan.
The key phrase is “objective criteria.” The Directive requires that pay differences between employees performing equivalent work be traceable to documented, consistently applied criteria: skill level, performance rating, geographic factor, or market benchmark. A compensation decision that exists because a manager negotiated differently with two employees, or because one hire came in during a period of higher market rates and the band was not adjusted, is not defensible under objective criteria standards. A data-driven compensation system is what makes objective criteria documentable and auditable.
The Directive also bans asking candidates about salary history before an offer is made, which changes how market data must be used in offer construction. Offers need to be grounded in verified market data for the role and level, not in what the candidate was previously earning. This strengthens the case for real-time benchmarking as the standard, because the historical anchor that many organizations default to is now prohibited in covered jurisdictions. For a full treatment of how pay transparency regulation connects to compensation benchmarking methodology, INOP’s guide on executive compensation benchmarking covers the compliance dimensions in detail.
Trust in AI for Compensation: What the 2026 Data Shows
Payscale’s 2026 Compensation Best Practices Report reveals that trust in AI for compensation decisions is genuinely divided. Only 28% of respondents trust AI for compensation benchmarking at all. 22% trust general-purpose AI tools to support compensation benchmarking. 21% trust only compensation-specific AI tools with disclosed methodologies. And a meaningful share do not trust AI for compensation benchmarking in any form.
This distribution matters for how you implement a data-driven compensation strategy. An analytics platform that arrives with AI-generated pay recommendations and expects HR leaders to act on them without understanding how the recommendations were produced will face resistance, and the resistance is justified. Compensation decisions affect real employees’ livelihoods, are subject to discrimination law, and need to be explainable when challenged. A recommendation from an unexplained model that the HR leader cannot interpret is not a useful tool.
The practical implication is that AI in compensation works best as an analytical layer that surfaces patterns, flags risks, and models scenarios, with human judgment making the final call and being able to explain it. The pay equity scan that flags 23 roles where women earn below the median for their job family and performance level is the AI contribution. The decision about how to address each gap, in what sequence, with what budget allocation, belongs to the compensation team. That division of labor makes the AI useful and the decisions defensible.
Overcoming Common Implementation Challenges
Data Fragmentation Across Systems
Compensation data typically lives in HRIS, payroll, performance management, and benchmarking survey systems that were not designed to share data with each other. Pay decisions made without a consolidated view of all four regularly produce internal equity problems: a manager approves an off-cycle adjustment that looks reasonable against the performance system but creates compression when viewed against the full salary distribution in the role family. The structural fix is a unified data layer that connects all four systems rather than reconciling them manually each time a compensation decision needs to be made.
Manager Readiness
Data-driven compensation is only as effective as the managers who execute it in individual pay conversations. A merit increase framework built on quartile positioning and performance ratings requires managers to understand what quartile positioning means, how to explain it to an employee, and how to handle the conversation when an employee disagrees with their placement. Most organizations invest significantly in building the analytics infrastructure and minimally in preparing managers to use and communicate it. Both investments are required.
Building Employee Trust
Employees are more likely to accept a pay decision they disagree with if they understand how it was made than if they receive an unexplained outcome. Communicating the inputs to pay decisions, the market data used, the performance factors considered, and the equity analysis that supports the decision does not require disclosing every employee’s salary. It requires explaining the process with enough specificity that employees can evaluate whether it was applied fairly to them. Organizations that make this communication investment report significantly lower pay-related grievances than those that maintain opacity around their compensation methodology.
Comparative Snapshot: Traditional vs. Data-Driven Pay in 2026
| Feature | Traditional Compensation | Data-Driven 2026 Strategy |
|---|---|---|
| Data Sources | Annual surveys, 12-14 months stale at point of use | Real-time market data, job posting aggregators, verified employee data |
| Benchmarking Level | Job title against job title | Skills profile against market rates for that specific capability combination |
| Update Frequency | Yearly | Continuous or quarterly for critical roles |
| Equity Analysis | Annual audit, gaps compound between cycles | Automated scanning after every merit cycle, offer round, and promotion |
| Decision Process | Manual, manager discretion, inconsistent criteria | Algorithmic flagging with human decision and documented rationale |
| Regulatory Readiness | Reactive to compliance requirements after they arrive | EU Pay Transparency Directive and SEC disclosure built into ongoing processes |
| AI Skills Pricing | Same band as non-AI variant of the role | Segmented benchmarking distinguishing AI-capable from AI-limited role variants |
| Budget Forecasting | Flat percentage increases against prior year actuals | Scenario modeling across merit, equity correction, and retention investment |
Case Study: Building a Data-Driven Pay Strategy at a Mid-Sized Tech Firm
A mid-sized technology company with 340 employees recognized in early 2025 that its compensation approach had three visible problems: offer rejections in engineering roles were running at 38%, pay-related grievances had increased significantly over the prior 18 months, and the annual compensation review was producing decisions that Finance did not trust because the underlying data was inconsistent across departments.
The organization started with a written compensation philosophy before touching any technology. The philosophy established market positioning at the 65th percentile for engineering and product roles, 50th for all other functions, with a defined process for skills-based adjustments above band for verified AI and data science capabilities. This document resolved an unspoken disagreement between the CEO and CFO about whether the company was trying to pay above or at market that had been producing inconsistent outcomes for two years.
Next, they connected their HRIS, performance management system, and a real-time benchmarking data feed into a unified compensation analytics platform. The first equity scan of this consolidated dataset identified 31 roles where pay fell outside the defined bands, including eight where the gap correlated with gender at statistically significant levels. All 31 were remediated within one quarter before the next annual review cycle.
The predictive modeling layer was introduced for the 2026 budget cycle. Three merit increase scenarios were modeled against retention risk data, market drift for critical roles, and equity correction costs. Finance selected the targeted 4.2% scenario over a flat 3% because the modeling demonstrated that the additional 1.2% concentrated in flight-risk roles would produce lower total cost than the replacement hiring triggered by the flat approach.
After twelve months, voluntary turnover in engineering dropped from 22% to 14%. Offer acceptance rates in product and engineering roles improved from 62% to 81%. Pay-related grievances fell by 68%. And the annual compensation review, which had previously taken six weeks, ran in eleven days because the data was current and the decision criteria were already defined.
Steps to Build a 2026-Ready Compensation Strategy
Step 1: Write the Compensation Philosophy First
Define market positioning by role family, the criteria for differentiation within bands, what counts as the relevant market for each function, and how the organization will communicate pay decisions to employees. This document should be approved at board or executive level before any platform decisions are made. It is the governance layer that keeps data-driven decisions consistent rather than just data-informed.
Step 2: Audit and Consolidate Your Data Foundation
Inventory every system that touches compensation data: HRIS, payroll, performance management, survey subscriptions, and ATS offer data. Identify where job title standardization breaks down, where performance ratings lack a consistent scale across departments, and where market benchmarking uses different survey sources for different functions. These inconsistencies are the source of most compensation analysis errors and need resolution before any analytics layer will produce trusted outputs.
Step 3: Implement Real-Time Benchmarking for Critical Roles First
Rather than attempting to replace all survey data simultaneously, start with the 15 to 20 role families where compensation competitiveness most directly affects hiring success and retention risk. These are typically engineering, data, product, and senior commercial roles. Get real-time market data flowing for these roles and demonstrate the value before expanding coverage. The Connors Group recommends refreshing salary bands for critical roles using current market data and publishing ranges internally before broader implementation, specifically to reduce the trust deficit that opacity around compensation creates.
Step 4: Automate Equity Scanning at Every Compensation Event
Configure automated equity analysis to run after every merit cycle, every cohort of new hire offers, and every round of promotions. Set thresholds that flag gaps for review before they reach the scale that requires formal remediation. This continuous monitoring approach is what separates organizations that maintain pay equity from those that restore it periodically after it has degraded.
Step 5: Build Predictive Modeling Into the Budget Cycle
Connect compensation data to financial planning so that merit increase decisions are presented to Finance as scenario comparisons with modeled outcomes, not as budget requests. Finance approves investments with expected returns. Presenting compensation investment in that format, with retention impact, replacement cost avoided, and equity correction cost modeled, produces better budget outcomes than presenting it as a percentage increase request.
Step 6: Train Managers on Pay Conversation Fundamentals
Managers who cannot explain how pay decisions are made will create the trust deficit that the entire data infrastructure was built to prevent. Invest in training that gives managers the language and the data to explain quartile positioning, market benchmarking, and the relationship between performance and pay in conversations with their teams. This training investment is consistently cited by organizations with high employee trust in compensation as more impactful than the analytics platform itself.
Frequently Asked Questions
What is a data-driven compensation strategy?
A data-driven compensation strategy uses real-time market data, internal equity analysis, performance metrics, and predictive modeling to make pay decisions rather than relying on annual salary surveys, flat percentage increases, and manager discretion. It connects compensation decisions to a documented philosophy, benchmarks at the skills level rather than the title level, runs pay equity analysis continuously rather than annually, and models budget scenarios before the merit cycle locks. The goal is pay that is competitive, equitable, and financially predictable rather than approximately right at the point of the last annual review.
How does the EU Pay Transparency Directive affect compensation strategy?
The Directive, now operative across EU member states from June 2026, requires annual gender pay gap reporting disaggregated by job category, a mandatory pay assessment and remediation plan when any category gap exceeds 5% without objective justification, and a ban on asking candidates about salary history before an offer is made. For compensation strategy, this means pay differences between employees doing equivalent work must be traceable to documented, consistently applied objective criteria: verified skills, performance ratings, or market benchmarks. A data-driven compensation infrastructure that documents these criteria at every decision point is the most direct path to compliance.
How should organizations price AI skills in compensation in 2026?
Standard title-based benchmarking does not capture the AI skills premium because it treats “Senior Data Analyst with advanced GenAI capability” and “Senior Data Analyst without it” as the same role. The practical solution requires two changes: updating job architecture to distinguish role variants by AI capability level, and using benchmarking data sources that segment by AI proficiency rather than title alone. Organizations that make this distinction reduce offer failures on AI-capable roles, reduce overpayment on AI-limited ones, and produce compensation decisions that reflect what the market actually prices rather than the historical average of a mixed population.
How often should salary bands be updated in a data-driven approach?
At minimum annually for stable role families. More frequently for roles in volatile skill markets: engineering, data science, AI development, and cybersecurity have all seen market rates move significantly within single calendar years, and annual review cycles leave organizations running on stale data for too long. Connors Group’s 2026 guidance recommends reviewing bands for critical roles whenever market data shows movement of 5% or more from the band midpoint, rather than waiting for the annual cycle. For roles where external hiring is actively happening, continuous monitoring of job posting data provides a real-time signal that a band review may be overdue.
What is pay compression and how does data-driven compensation prevent it?
Pay compression occurs when new hire offers are made at current market rates while existing employee salaries trail those rates because annual merit increases have not kept pace with market movement. A tenured employee earning $95,000 discovers that a colleague hired six months ago for the same role earns $108,000. The data-driven prevention is automated market drift monitoring: when the external benchmark for a role moves more than a defined threshold above the band midpoint, the system flags existing employees below that threshold for review rather than waiting for them to discover the gap externally. For a complete treatment of how skills-based pay band design builds structural protection against compression, INOP’s guide on building skills-based pay bands covers the construction methodology.
How should compensation analytics connect to workforce planning?
The connection runs in two directions. Workforce planning informs compensation by identifying where skills demand is rising and where market rates are likely to move before the annual benchmarking data captures the shift, allowing proactive band adjustments. Compensation data informs workforce planning by flagging where current pay positions create retention risk in roles the business plan depends on, and by modeling the fully loaded cost of different gap closure pathways — building capability internally, hiring externally, redeploying internal talent — so that planning decisions include accurate cost comparisons. For a full treatment of how this connection works in predictive workforce planning, INOP’s guide on modern workforce forecasting covers the integration methodology.