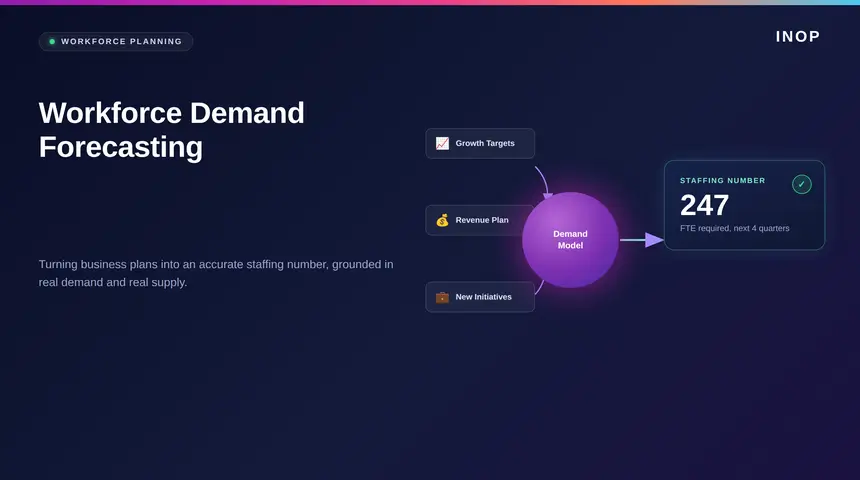
Workforce demand forecasting is the process of predicting how many people, with which skills, a business will need to deliver its plan. It is also called labor demand forecasting, and it turns a goal such as revenue growth, a product launch or a new market into a staffing number broken down by role, skill and proficiency.
Workforce demand forecasting is the business-driven half of workforce planning. The other half, supply forecasting, estimates what the organization will have. When the demand side is wrong, every decision that follows inherits the error: training budgets go to the wrong skills, redeployment moves the wrong people, and capacity arrives too late. This guide covers what demand forecasting predicts, the data it needs, a step-by-step process, how to choose a method and a system, and how to turn a forecasted gap into a decision. For the full picture across both sides, see our complete guide to workforce forecasting.
What workforce demand forecasting predicts
Demand forecasting answers one question: what will the business need? A useful answer goes beyond headcount. It names the roles, the skills inside those roles, the proficiency level required and the date by which the capacity has to be in place.
Workforce demand forecasting vs supply forecasting
| Demand forecasting | Supply forecasting | |
|---|---|---|
| Question answered | What will the business need? | What will the organization have? |
| Main drivers | Revenue, volume, launches, productivity | Attrition, internal moves, retirements |
| Typical inputs | Business plan, workload ratios, scenarios | HR records, turnover history, skills profiles |
| Output | Required roles and skills by date | Available roles and skills by date |
The gap between the two is what leaders act on. A forecast that shows demand without supply, or supply without demand, cannot tell you where to invest.
Workforce demand sensing: short-horizon signals
Workforce demand sensing uses near-term signals, such as orders, sales pipeline, project start dates and seasonal patterns, to adjust a forecast within a short window. Long-range forecasting sets the capacity plan. Demand sensing tells you when to act inside it, for example bringing a redeployment forward because a large contract closed early.
The data foundation behind an accurate forecast
Method matters less than data. Four categories of data support a reliable workforce demand forecast:
- Internal workforce data: timesheets, overtime, absenteeism, turnover and current skills profiles.
- Capacity lead time: how long each route to capacity takes, from reskilling an internal team to bringing in an external specialist.
- External labor market data: supply, demand and pay for each skill outside the organization.
- Business cycle and seasonal trends: the patterns that make demand rise and fall through the year.
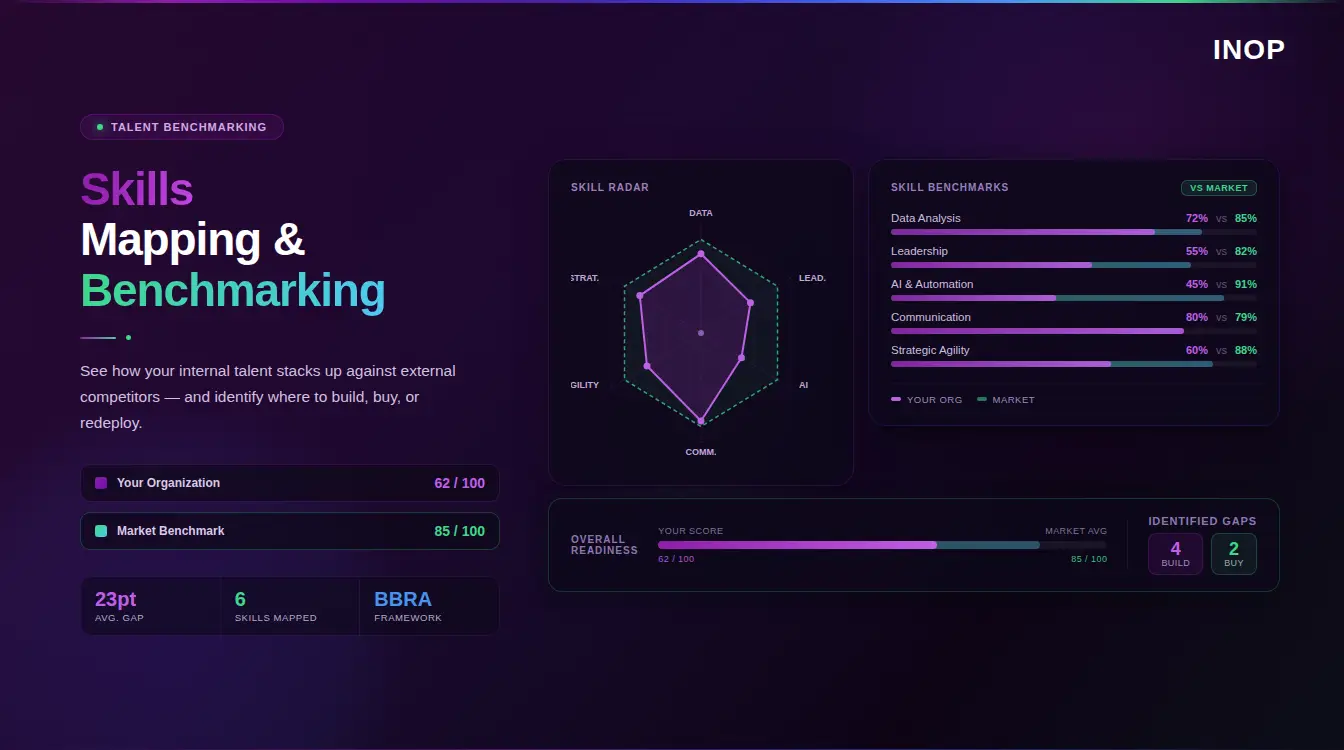
Common problems include job titles that mean different things in different business units, turnover logs that lag by months, and contractor hours mixed in with employee data. Fixing these comes before choosing a method. External demand data is where most organizations are weakest, which is why INOP’s skills intelligence maps external skills demand signals to your own skills taxonomy, so the forecast reflects where the market is moving.
Using historical data to predict workforce demand
Historical data is the starting point for most workforce demand predictions, but only when it is linked to the business activity that drove it. Two years of headcount on its own shows how many people you had, not how many you needed. Pair each period’s staffing with the volume it supported, such as orders, projects, accounts or revenue, and the ratio between them becomes a usable demand driver.
Three checks keep historical data honest. First, remove periods distorted by one-off events, such as a freeze or a restructure. Second, separate overtime and contractor hours from employee headcount, because both hide real demand. Third, adjust for productivity change: if new tools or AI have cut the time a task takes, last year’s ratio will overstate next year’s need.
How to forecast workforce demand step by step
A workforce demand forecast follows the same sequence whether you plan for one team or the whole organization.
- Start with the business driver. Name the goal and its timing: the revenue target, the launch date or the new site.
- Translate the driver into roles and skills. Use a structured framework such as competency mapping to describe what each role requires, not only how many people.
- Gather the data. Collect internal, lead time, external and seasonal data for each role in scope.
- Choose a method that fits. Match the method to how stable demand is and how much history you have.
- Build scenarios. Model a base case, a downturn and an accelerated case.
- Compare demand with supply. Size the gap by role and skill, not as one headcount figure.
- Model the response. Compare the options for closing each gap on cost, speed and risk.
- Review on a fixed cycle. Update the forecast on a set schedule and after any event that changes its assumptions.
This order mirrors how the U.S. Bureau of Labor Statistics builds its employment projections: it projects economic output first and derives employment from it. Business output comes first, and the people number follows from it.
Choosing the right workforce demand forecasting method
Choose a method for fit, not sophistication. A simple model that finance trusts will change more decisions than a complex one nobody can explain.
| Method | Best use | Data needed | Main limit |
|---|---|---|---|
| Time series | Stable, repeating demand | Two or more years of history | Assumes the past repeats |
| Regression | Demand tied to clear drivers | History of drivers and staffing | Breaks when drivers change |
| Machine learning | Complex, nonlinear demand | Large, clean datasets | Harder to explain |
| Scenario planning | Volatile or high-growth conditions | Business assumptions | Depends on scenario quality |
Time series and regression for stable environments
Time series models project demand from its own history and are easy to explain. Regression links staffing to drivers such as sales volume or active accounts. Both assume the relationship between the past and the future holds, so they work well in steady conditions and poorly during a shift in strategy or technology.
Machine learning and AI for complex, shifting demand
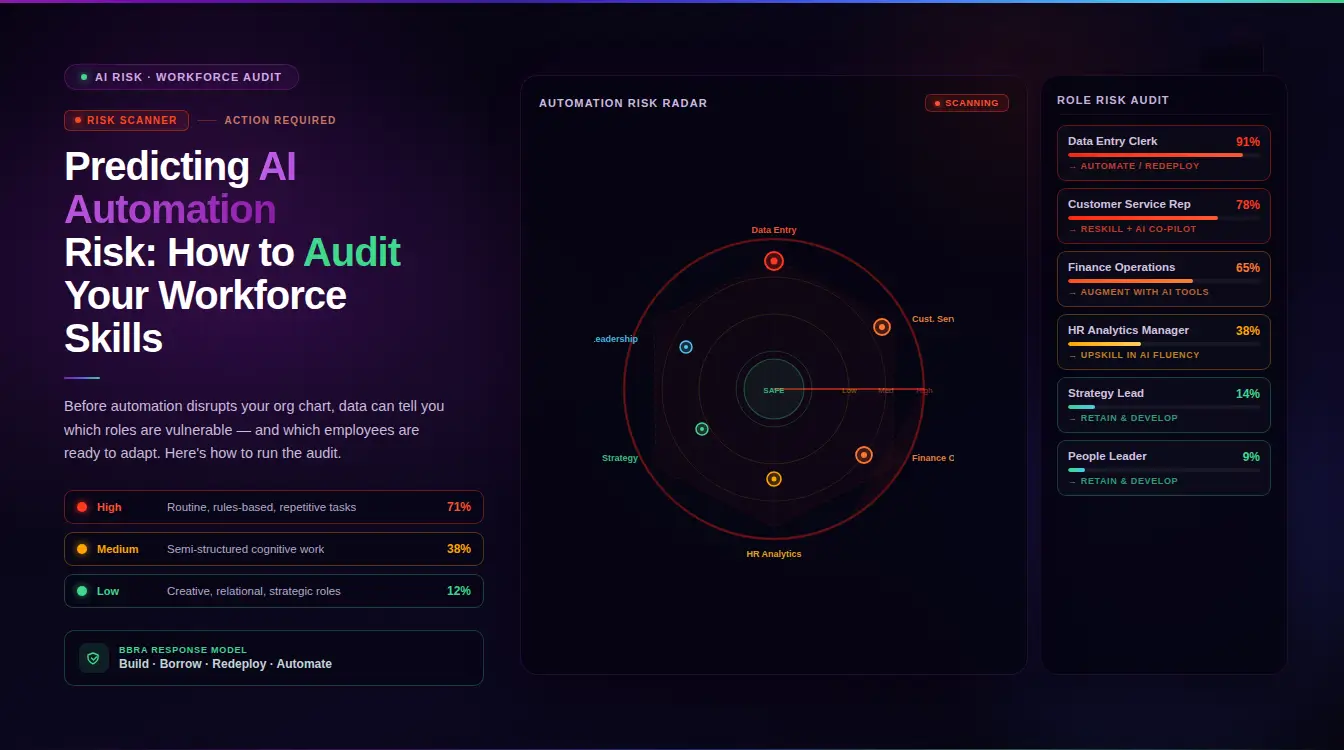
Machine learning detects nonlinear patterns and adapts as new data arrives, but it needs substantial history and is harder to explain to finance and business leaders. AI also changes demand itself: it can reduce the work in some roles while creating work in others. Our guide to predicting AI automation risk shows how to build that effect into the forecast.
Scenario planning for volatile or high-growth conditions
Scenario planning builds several versions of the future, such as a downturn, an accelerated launch or slower external supply, and sizes demand in each. A single-point forecast can create false precision; scenarios show the range leaders need to plan for. Stress-test pay under the same scenarios as headcount, as our guide to scenario planning for compensation strategy explains.
How to measure forecast accuracy
Test a model on data it did not see while it was being fitted. Rob Hyndman’s guidance on measuring forecast accuracy recommends holding out the most recent data, roughly the last 20 percent when history allows, or using time series cross-validation for short series. Common error measures are MAE, RMSE, MAPE and MASE. Track bias as well as error: a forecast that runs high every cycle drives the same wrong decision every cycle.
Choosing a workforce demand forecasting system
Workforce demand prediction systems fall into two groups that answer different questions. Workforce management tools forecast labor demand by shift, store or contact center interval, so managers can schedule the right number of people next week. Strategic workforce demand forecasting looks one to three years ahead and asks which roles and skills the business plan will require. Many organizations need both, but they are rarely the same product.
When you evaluate a system for strategic workforce demand management, test it against five criteria:
- Driver-based models: demand is built from business drivers such as revenue, volume or launches, not only from past headcount.
- Skill-level output: the forecast names roles, skills and proficiency, not a single headcount number.
- Scenario modeling: base, downturn and accelerated cases can be compared side by side.
- External market data: the system shows whether a gap is practical to close at today’s market supply and price.
- A decision layer: each gap connects to costed response options, not only a dashboard.
The last criterion matters more each year. The World Economic Forum expects nearly 40% of the skills required on the job to change by 2030, so a forecast that projects past roles forward will miss the skills the plan needs most. For a wider view of the category, see our guide to analytics tools that model future workforce requirements.
Why demand forecasts break down without a decision layer
Most demand forecasts fail on connection, not on math. The forecast lands in a report, and without a structured way to compare responses, the organization defaults to buying capability from outside because it feels fastest.
Take an illustrative case: the plan requires forty additional engineers within twelve months. The forecast says forty. It does not say whether to reskill adjacent teams, bring in external specialists, move people from a declining product line or automate part of the work. Predictive analysis says what is likely to happen; prescriptive analysis compares what to do about it. Our article on predictive compared with prescriptive outputs covers the difference. Forecasts also go stale faster than annual planning cycles, so the decision layer has to run on the same cadence as the forecast.
INOP’s five intelligence lenses applied to workforce demand forecasting
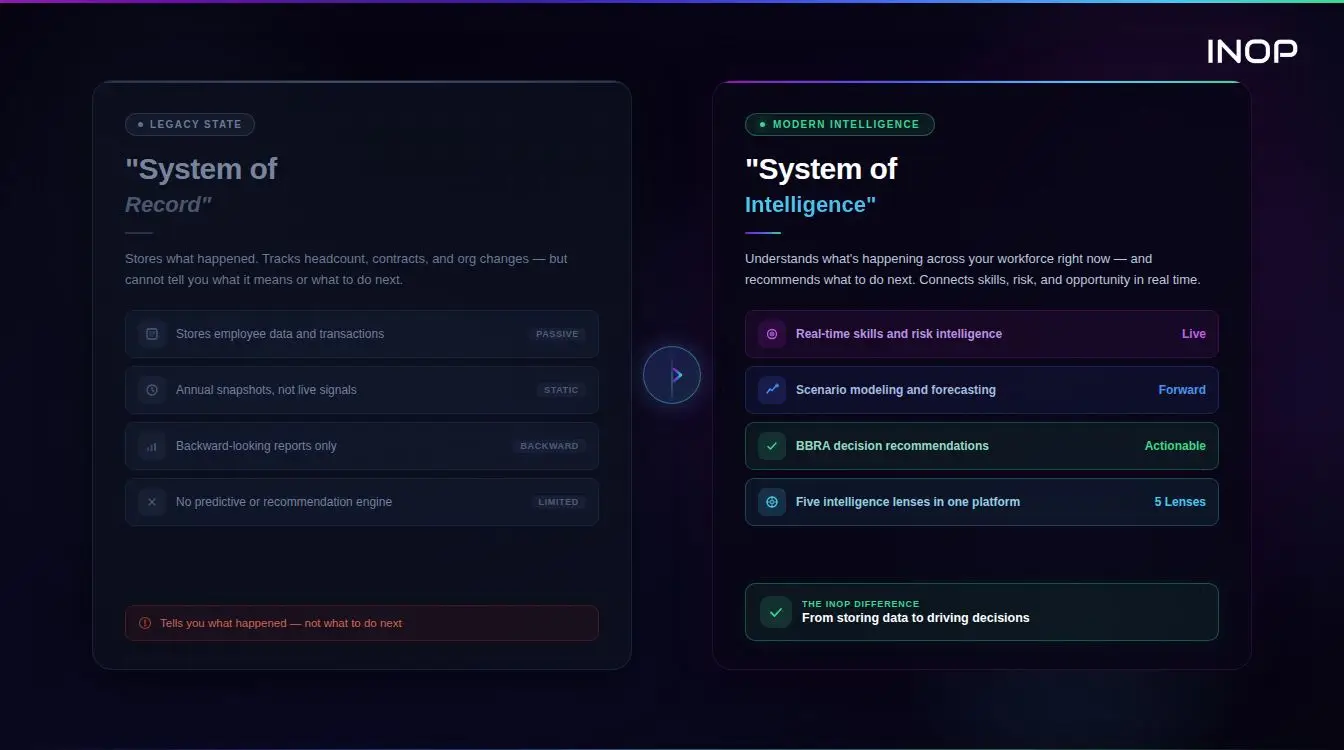
INOP never assesses a forecasted gap in isolation. Each gap is tested through five intelligence lenses before a response is chosen:
- Strategy: is the demand tied to a strategic priority, and when does the strategy need it?
- Finance: what does each way of closing the gap cost, and what does the gap cost if nothing changes?
- People: who inside the organization holds adjacent capability and could move?
- Market: how available and how expensive is the skill outside the organization?
- AI and Automation: can automation meet part of the demand, and how will AI change the work itself?
The answer to the question INOP is built around follows from these lenses: does the organization have the capabilities to execute its strategy today and stay AI-ready as AI changes the work?
BBRA: turning a forecasted gap into a modeled response
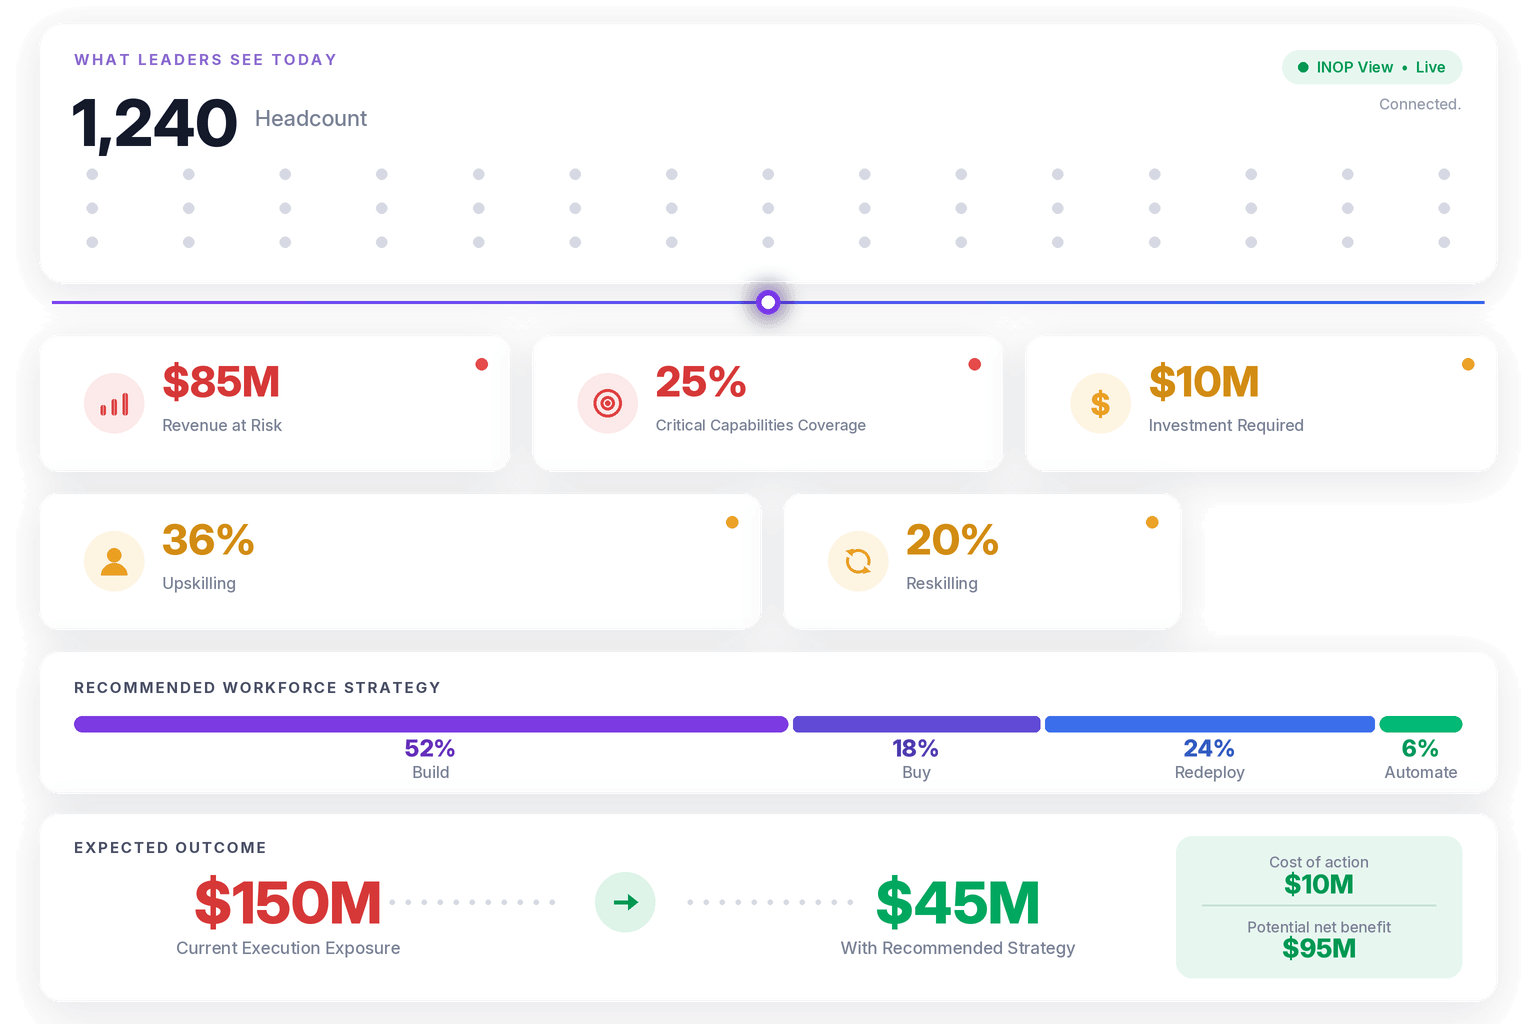
BBRA is INOP’s proprietary decision architecture for closing capability gaps. It compares four pathways on the same basis:
- Build: reskill or upskill people who hold adjacent skills.
- Buy: bring the capability in from the external market.
- Redeploy: move existing people to where the strategy needs them.
- Automate: redesign the work where AI can take on part or all of it.
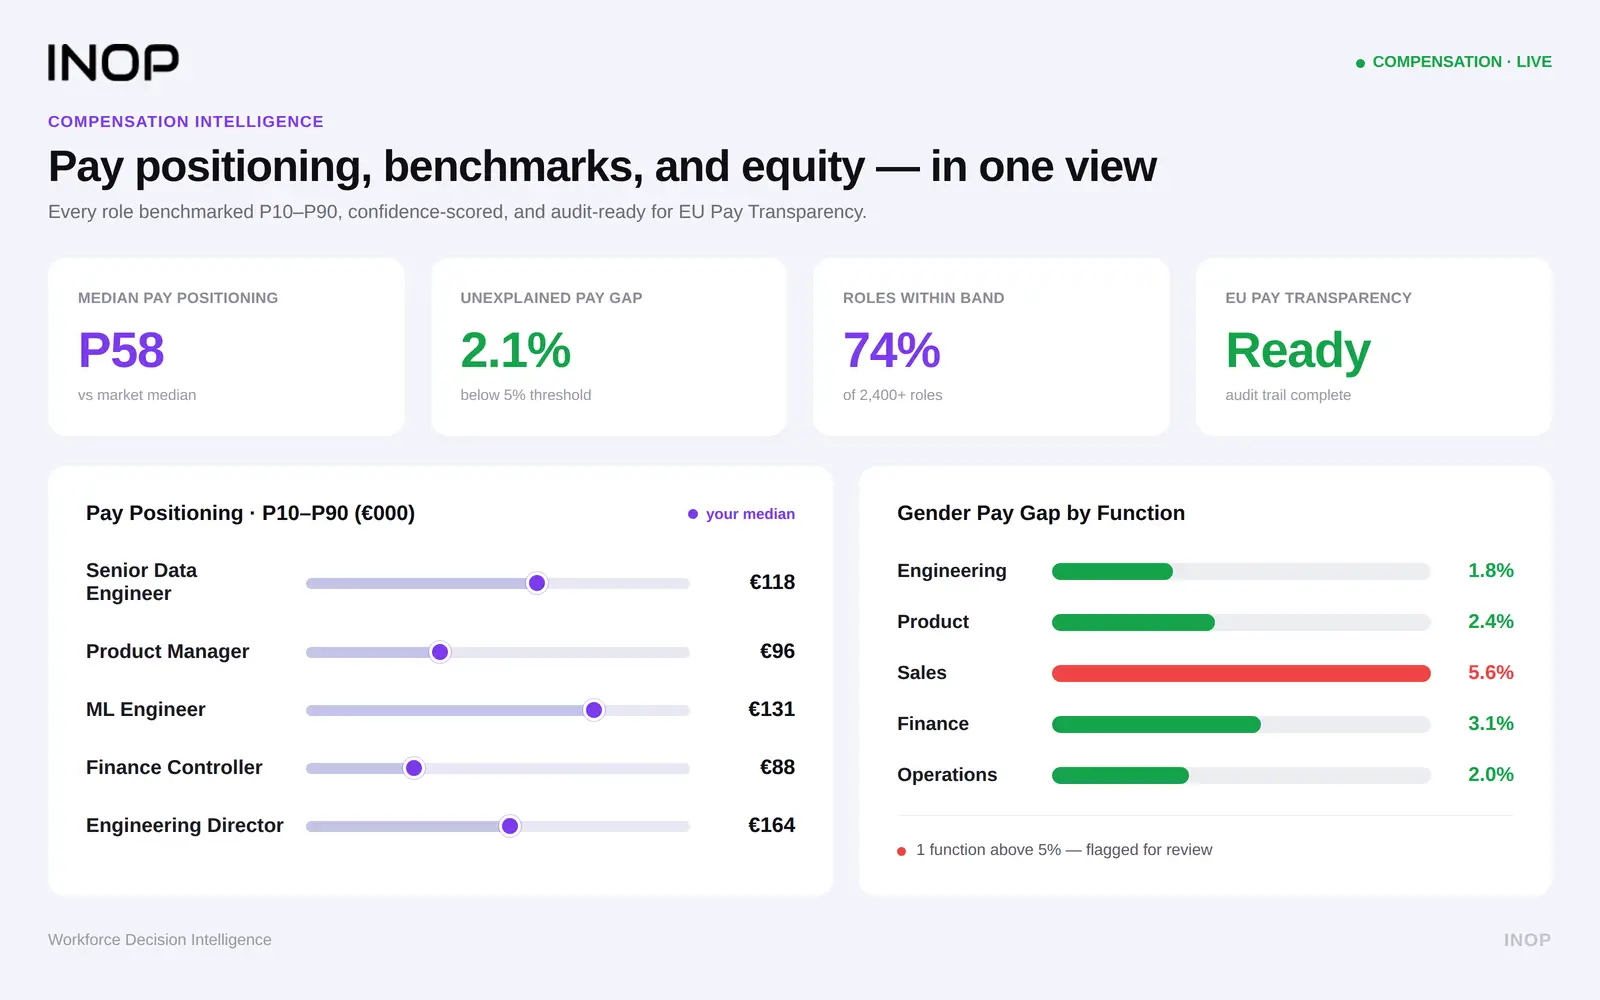
Each pathway carries its own financial trade-offs, and INOP models them across four time horizons: 30 days, 180 days, one year and three years. The cheapest option at 30 days is often not the cheapest at three years. Pricing the Buy and Build options depends on current pay data, which INOP’s compensation analytics platform supplies for each role and skill.
How to shift workforce capacity based on demand trends
- Detect shifts early. Use demand sensing and external skills signals to spot change before it reaches delivery.
- Size the gap by role and skill. Quantify what is missing, not just how many people.
- Compare the four pathways. Run Build, Buy, Redeploy and Automate through the same cost and time model.
- Choose a mix. Most gaps close fastest and cheapest with a combination rather than one lever.
- Set trigger points. Agree in advance which signal moves you to the next action.
See a demand forecast turned into a costed decision. Watch INOP size a capability gap and compare Build, Buy, Redeploy and Automate across four time horizons. Book a demo
Workforce demand forecasting for private equity operating partners
For operating partners, a disconnected demand forecast is a value creation risk. A growth plan that assumes new capacity without a skill-level staffing plan behind it tends to slip in the first hundred days, and the gap is rarely visible in diligence.
Standardizing workforce demand forecasting across the portfolio lets partners test whether each company’s growth assumptions tie to a realistic plan by role and skill. INOP runs the analysis at organization, business unit, department or country level, and works with role and task data where employee-level data is not available. Scarce skills also carry pay premiums that a headcount figure hides, so INOP prices each gap before it reaches the value creation plan. Learn more about how INOP supports private equity operating partners.
Common mistakes in workforce demand forecasting
Forecasting headcount without forecasting skills
A headcount number without skill and proficiency detail cannot guide development, redeployment or sourcing. Forecast skills first and let the headcount follow. Our headcount planning guide shows how to keep the two connected.
Choosing a method for sophistication instead of fit
Simple models that leaders understand often outperform complex ones in practice, because they get used.
Treating the forecast as static
Review the forecast on a fixed cycle and after any event that changes its assumptions, such as a delayed launch or a budget change.
Ignoring supply-side losses
Demand is only half the gap. Gallup estimates that replacing an employee costs one-half to two times their annual salary, so a demand forecast that ignores attrition understates both the gap and its cost. Connect the forecast to workforce risk management so flight risk in critical roles is part of the picture.
Never connecting the forecast to a modeled response
Without a comparison of Build, Buy, Redeploy and Automate, the forecast remains a projection. Tie each gap to costed options before it reaches the budget round.
Leaving forecast ownership entirely with HR
Finance and business unit leaders should validate the drivers, costs and timelines. A forecast owned jointly is a forecast the business acts on. INOP’s strategic workforce planning platform gives HR, finance and business leaders one shared model to work from.
Connect the forecast to a decision
An accurate workforce demand forecast names skills, rests on data you trust, tests more than one scenario and leads to a decision. Start from the business driver, size the gap by role and skill, compare the pathways across four time horizons and review on a fixed cycle. Do that, and the forecast stops being a number in a report and becomes the plan for how the business will deliver its strategy.
Run your next demand forecast through BBRA. See how INOP connects strategy, finance, people, market and AI in one model. Book a demo
Workforce demand forecasting FAQs
What is the difference between workforce demand forecasting and supply forecasting?
Demand forecasting estimates the roles and skills the business will need to deliver its plan. Supply forecasting estimates what the organization will have after attrition, internal moves and retirements. Workforce planning compares the two and decides how to close the gap.
Which workforce demand forecasting method is most accurate?
No single method wins in every situation. Time series and regression suit stable conditions, machine learning suits complex patterns with enough history, and scenario planning suits volatile or high-growth conditions. Test any method on data it has not seen before you rely on it.
How often should a workforce demand forecast be updated?
Update it monthly for operational alignment and quarterly for strategic shifts. Also update it after any material change to its assumptions, such as a delayed launch, an acquisition or a budget revision.
Why does an accurate forecast sometimes fail to change staffing decisions?
Because it is not connected to a comparison of responses. INOP’s BBRA framework models Build, Buy, Redeploy and Automate for each gap across 30 days, 180 days, one year and three years, so the forecast leads straight to a costed decision.
How should private equity operating partners evaluate a portfolio company’s demand forecast?
Check whether the growth assumptions link to a staffing plan by role and skill, test the plan under downturn and accelerated scenarios, and compare the cost of each response over time. A forecast that only shows headcount is a warning sign for the value creation plan.