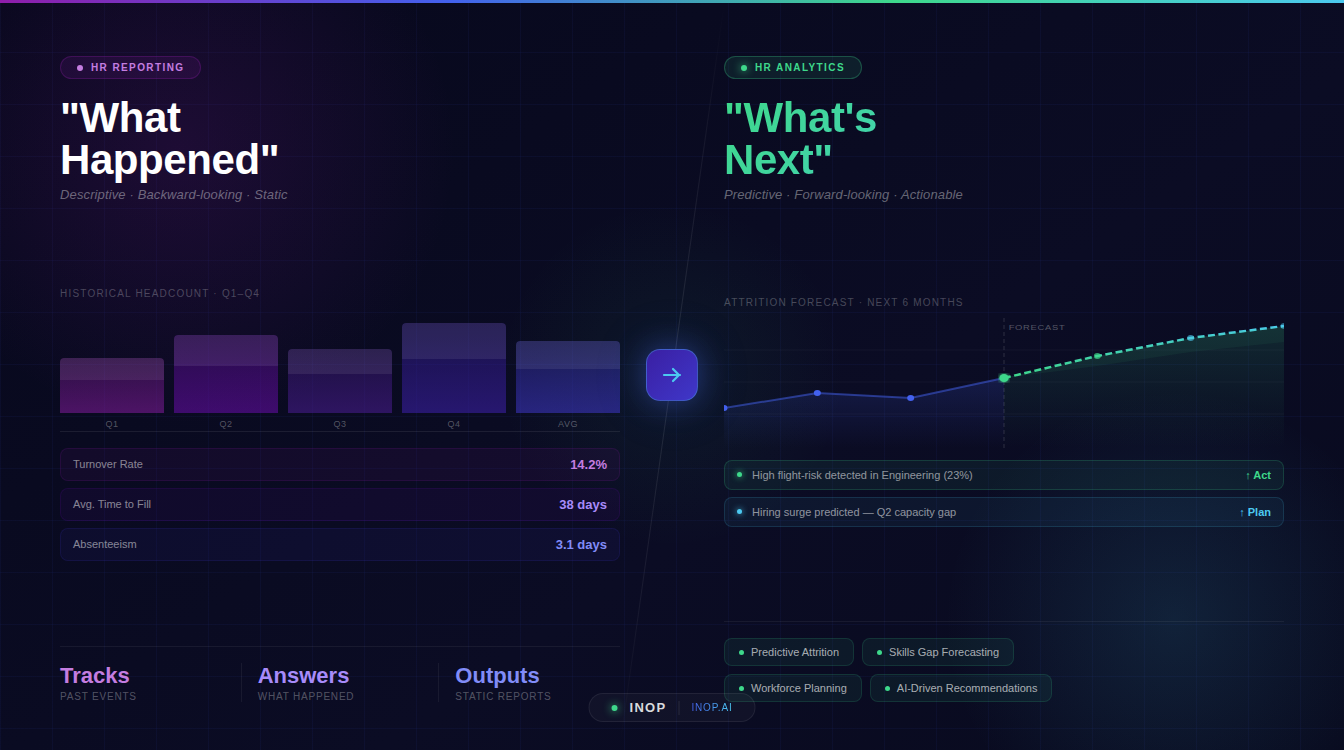
HR reporting and analytics are two parts of one discipline. HR reporting tells you what happened in your workforce: headcount, turnover, absence, pay. HR analytics explains why it happened, what is likely to happen next and what to do about it. Both use the same data, but reporting organizes it into counts, rates and dashboards, while analytics applies statistics and models to find causes, forecast outcomes and compare options. This guide defines both, lists the main types of HR reports, explains the four levels of HR analytics, compares HR analytics with people analytics and workforce analytics, and shows how to build an HR reporting and analytics function that drives decisions.
What Is HR Reporting and Analytics?
HR reporting and analytics is the practice of collecting, organizing and analyzing workforce data to give leaders an accurate record of the workforce and evidence for decisions about it. In most organizations it sits in HR operations or a people analytics team and works closely with finance.
HR Reporting Definition
HR reporting is the regular collection and presentation of historical workforce data. It answers descriptive questions: how many people work here, how many left, how much we pay, how many days were lost to absence. Good reporting is accurate, consistent and on time, and it is the foundation every analytics effort builds on.
HR Analytics Definition
HR analytics applies statistical methods and models to workforce data to explain outcomes, predict them and guide decisions. It connects HR data with business data, so leaders can see how workforce factors affect cost, delivery and risk.
Types of HR Reports
Most HR reporting falls into a small set of standard reports.
| Report type | What it shows | Typical audience |
|---|---|---|
| Headcount and composition | People by team, location, level and contract type | Leadership, finance |
| Turnover and retention | Voluntary and involuntary exits, retention rates | Leadership, HR business partners |
| Absence | Absence rates and patterns | Line managers, HR |
| Compensation and benefits | Pay totals, averages and distribution | Finance, rewards |
| Learning and development | Completions, hours and spend | HR, learning teams |
| Internal mobility | Promotions and transfers | Leadership, talent teams |
| Compliance and human capital reporting | Statutory and disclosure metrics, such as pay gap figures | Legal, board, regulators |
For external human capital reporting, standards such as ISO 30414 set out which workforce metrics to disclose. For presenting reports to leadership, see how to build an HR analytics dashboard the C-suite uses.
The Limits of Reporting Alone
Reports look backward. By the time a turnover rate rises in a quarterly report, the people have already gone. Reports show what changed but not why, so leaders are left to guess the cause, and they rarely say what to do next. An organization that stops at reporting can describe its problems in detail and still be surprised by them.
Levels of HR Analytics: The Four Types
AIHR describes four types of HR analytics. They work as levels of maturity, each answering a harder question.
| Level | Question | Reporting or analytics? |
|---|---|---|
| Descriptive | What happened? | Reporting |
| Diagnostic | Why did it happen? | Analytics |
| Predictive | What is likely to happen? | Analytics |
| Prescriptive | What should we do about it? | Analytics |
Reporting covers the first level. Analytics starts at the second. For a closer look at the top two levels, read predictive vs prescriptive HR analytics.
HR Reporting vs HR Analytics: The Key Differences
| Dimension | HR reporting | HR analytics |
|---|---|---|
| Core question | What happened? | Why, what next and what to do |
| Time focus | Past | Past, present and future |
| Methods | Counts, rates, trends | Statistics, models, scenarios |
| Data scope | Mostly HR systems | HR, finance, operations and market data |
| Output | Reports and dashboards | Insights, forecasts and recommendations |
| Typical owner | HR operations | People analytics, with finance and business leaders |
| Value | Visibility and compliance | Better decisions and lower risk |
The two are complementary. Analytics depends on clean, consistent reporting, and reporting gains value when it feeds analysis.
HR Reporting vs HR Analytics: Same Metric, Two Views
The table shows how the same metric reads in a report and in an analysis. The figures are illustrative.
| Metric | HR reporting view | HR analytics view |
|---|---|---|
| Turnover | Turnover rose from 12 to 19 percent this year | Exits cluster in one skill group paid below the market midpoint, and the model flags more risk in the next two quarters |
| Absence | Absence averaged six days per employee | Absence rises in teams with high overtime, which predicts later exits |
| Pay | Average pay rose four percent | Increases went mostly to people already above midpoint, widening gaps in critical roles |
| Skills | Training hours increased | The skills the strategy needs are still short, and redeploying adjacent staff costs less than external sourcing |
When Reporting Is Enough and When You Need Analytics
Reporting is enough for compliance, routine monitoring and questions with a clear, stable answer, such as headcount for a budget. You need analytics when the question involves causes, the future or a choice between options: why people leave, which skills will run short, where pay creates risk, or how to close a capability gap at the lowest cost.
HR Analytics vs People Analytics vs Workforce Analytics
The three terms overlap and are often used interchangeably. Where people draw a line, it usually looks like this.
| Term | Common focus | Typical questions |
|---|---|---|
| HR analytics | HR processes and programs | Is our absence policy working? Where is turnover highest? |
| People analytics | People and their effect on business results | Which manager practices lift performance and retention? |
| Workforce analytics | The whole workforce as a resource, including planning, cost and contingent labor | Do we have the skills and capacity for next year’s plan, and at what cost? |
The labels matter less than the questions. Pick the ones tied to your decisions. For the wider data picture that joins all three, read talent intelligence.
What to Include in an HR Analytics Report
An HR analytics report differs from a standard HR report because it leads to a decision. A useful structure has six parts.
- The business question the report answers.
- The finding, stated in one or two sentences.
- The drivers behind it, with the evidence.
- The forecast if nothing changes.
- The options, each with cost, speed and risk.
- The recommendation and who owns the next step.
Keep the descriptive metrics in an appendix or a dashboard. Leaders read the first page.
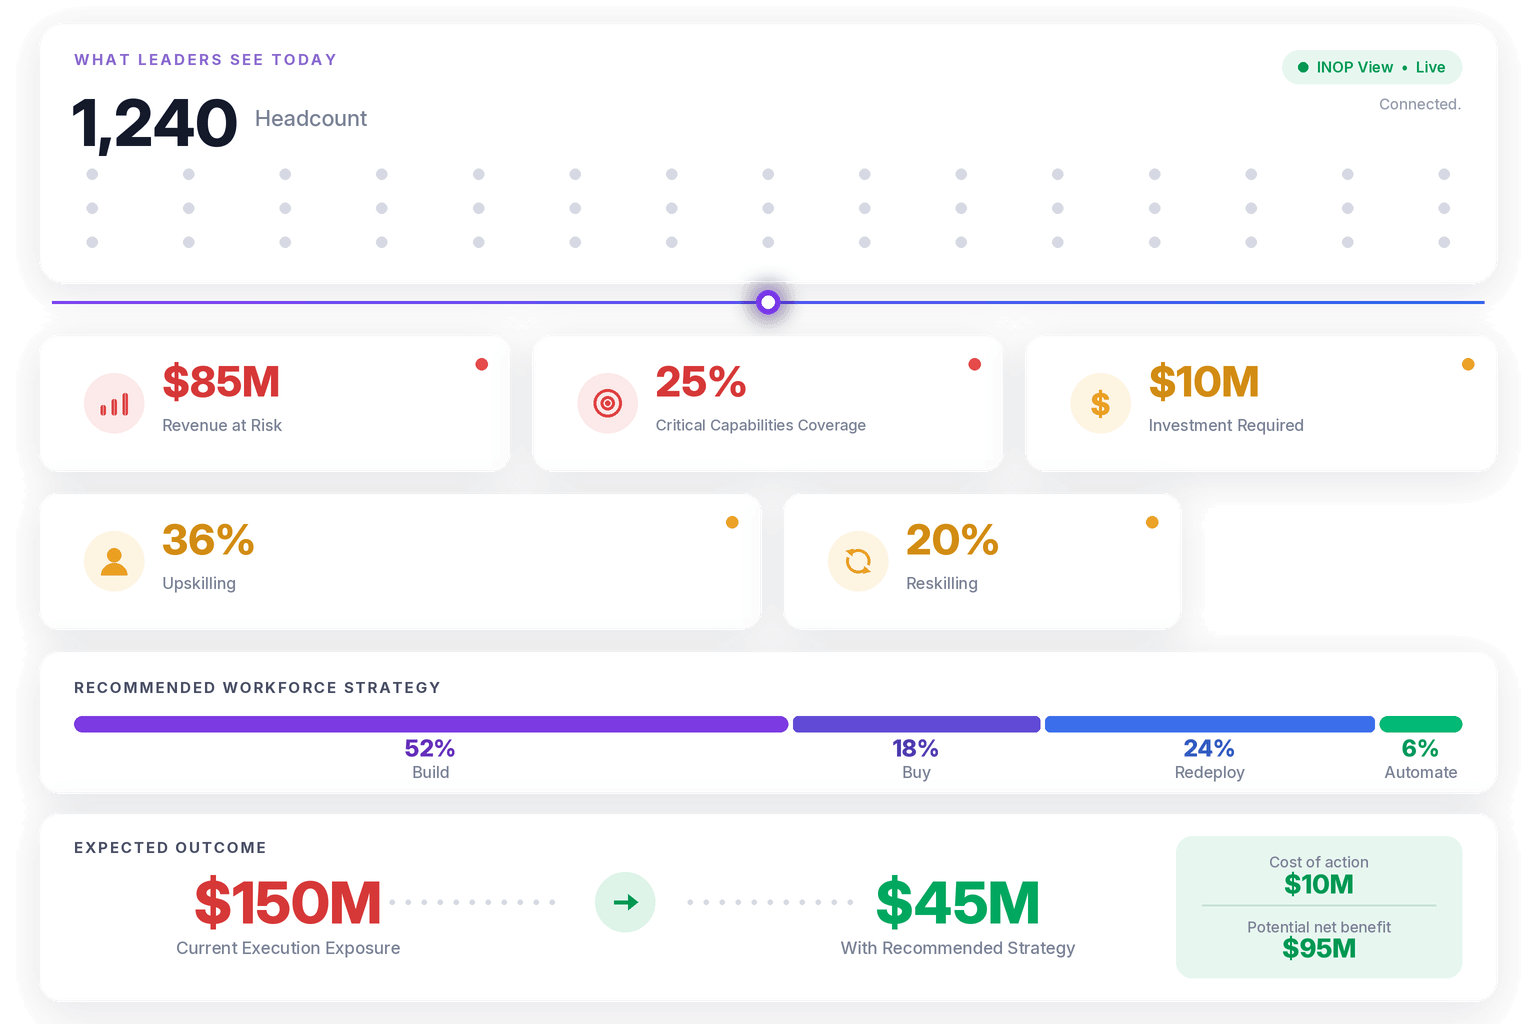
Why Workforce Decision Intelligence Is the Next Step
Analytics explains and predicts. Workforce decision intelligence goes one step further and connects those insights to priced decisions. The stakes are high. Gallup’s 2024 State of the Global Workplace report estimated that low employee engagement costs the global economy US$8.9 trillion, or 9 percent of global GDP, according to Gallup’s release. Reports can show engagement falling. Decision intelligence shows where it matters most and what each response costs.
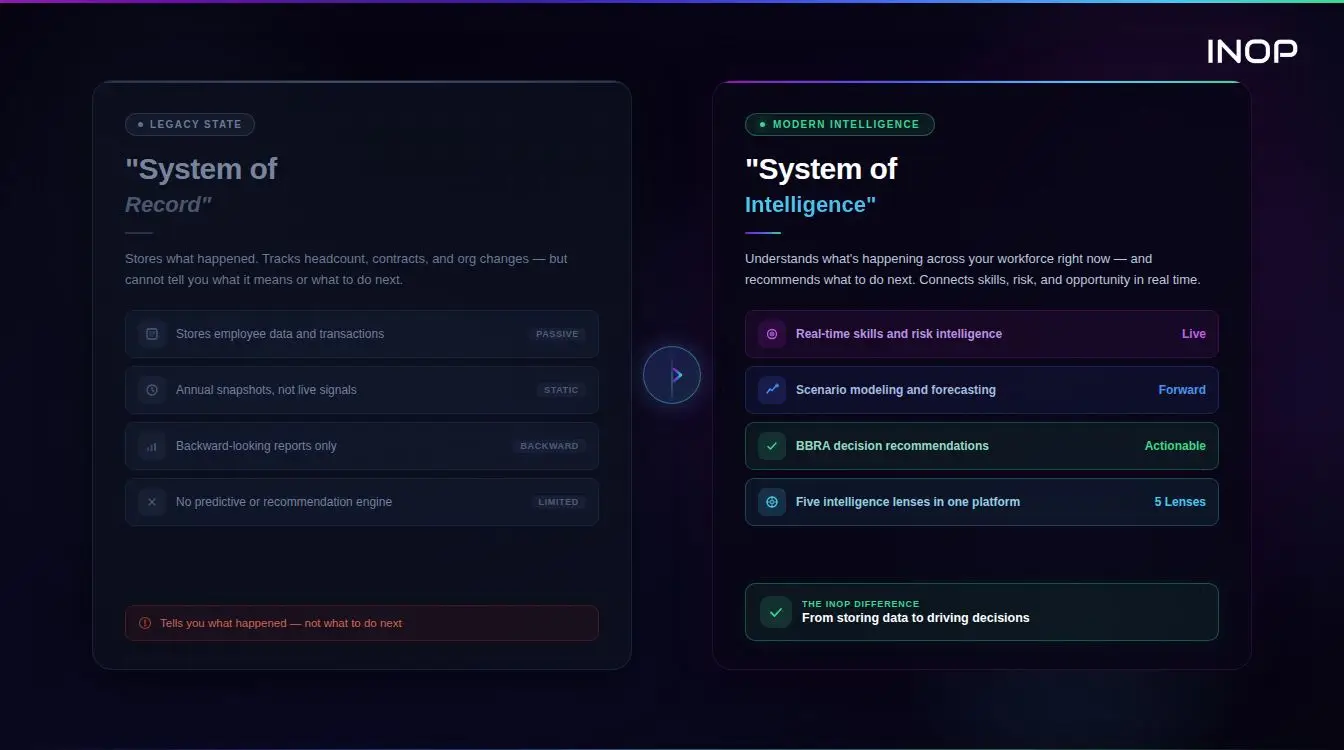
For the full concept, read what workforce decision intelligence is, and for the shift in systems behind it, from system of record to system of intelligence.
The INOP Intelligence Framework: Five Lenses on Workforce Data
INOP answers whether leaders have the capabilities to execute their strategy today and stay AI-ready. It never assesses AI in isolation. It tests every workforce decision against five intelligence lenses.
- Strategy: does the decision support a priority that justifies investment?
- Finance: what does each option cost over time?
- People: which skills and adjacent skills does the organization already hold?
- Market: how scarce and expensive are the skills outside?
- AI and Automation: how will automation change the work?
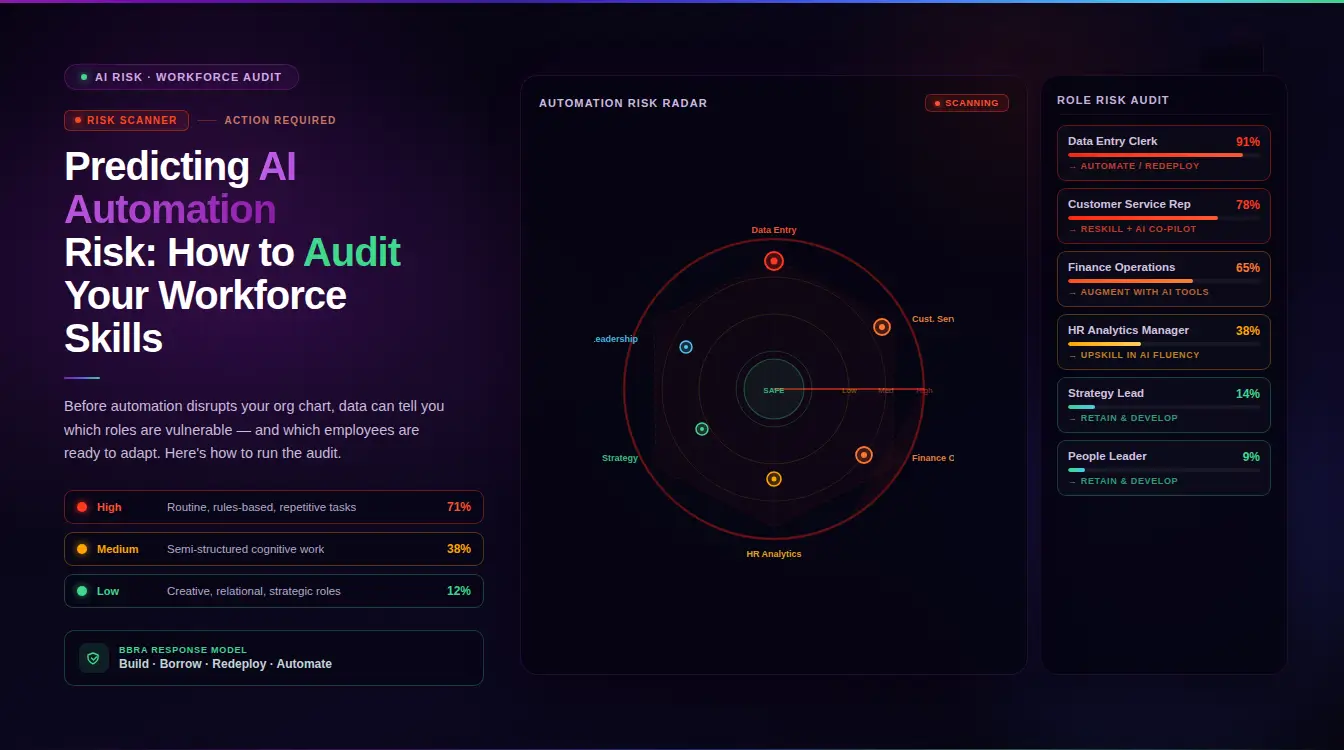
The result feeds BBRA, INOP’s proprietary decision architecture: Build, Buy, Redeploy, Automate. BBRA models all four pathways with financial trade-offs across 30-day, 180-day, one-year and three-year horizons.
Move from HR reports to priced workforce decisions. INOP connects skills, market data and cost in one view. Book a demo
Where HR Analytics Creates Real Value
Analytics pays off where a decision carries a clear cost or risk. Five areas stand out.
Strategic Workforce Planning
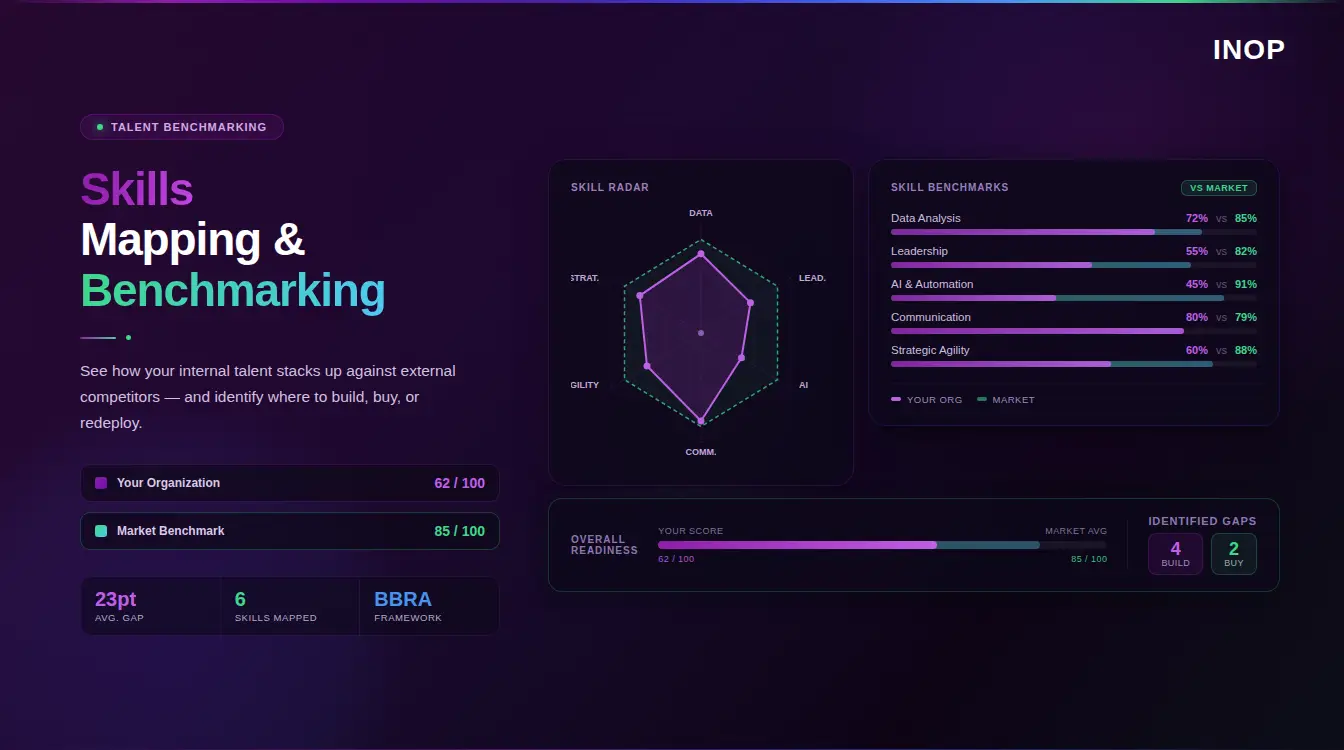
Analytics compares the skills the strategy needs with the skills the organization holds and prices each way of closing the gap. INOP’s strategic workforce planning platform links skills supply to demand. See workforce demand forecasting for the method.
Retention and Engagement
Gallup reports that replacing an employee costs one-half to two times the employee’s annual salary, according to its turnover research. Reports count exits after they happen. Analytics shows where risk concentrates in scarce skills, so managers can act first.
Pay Equity and Compensation
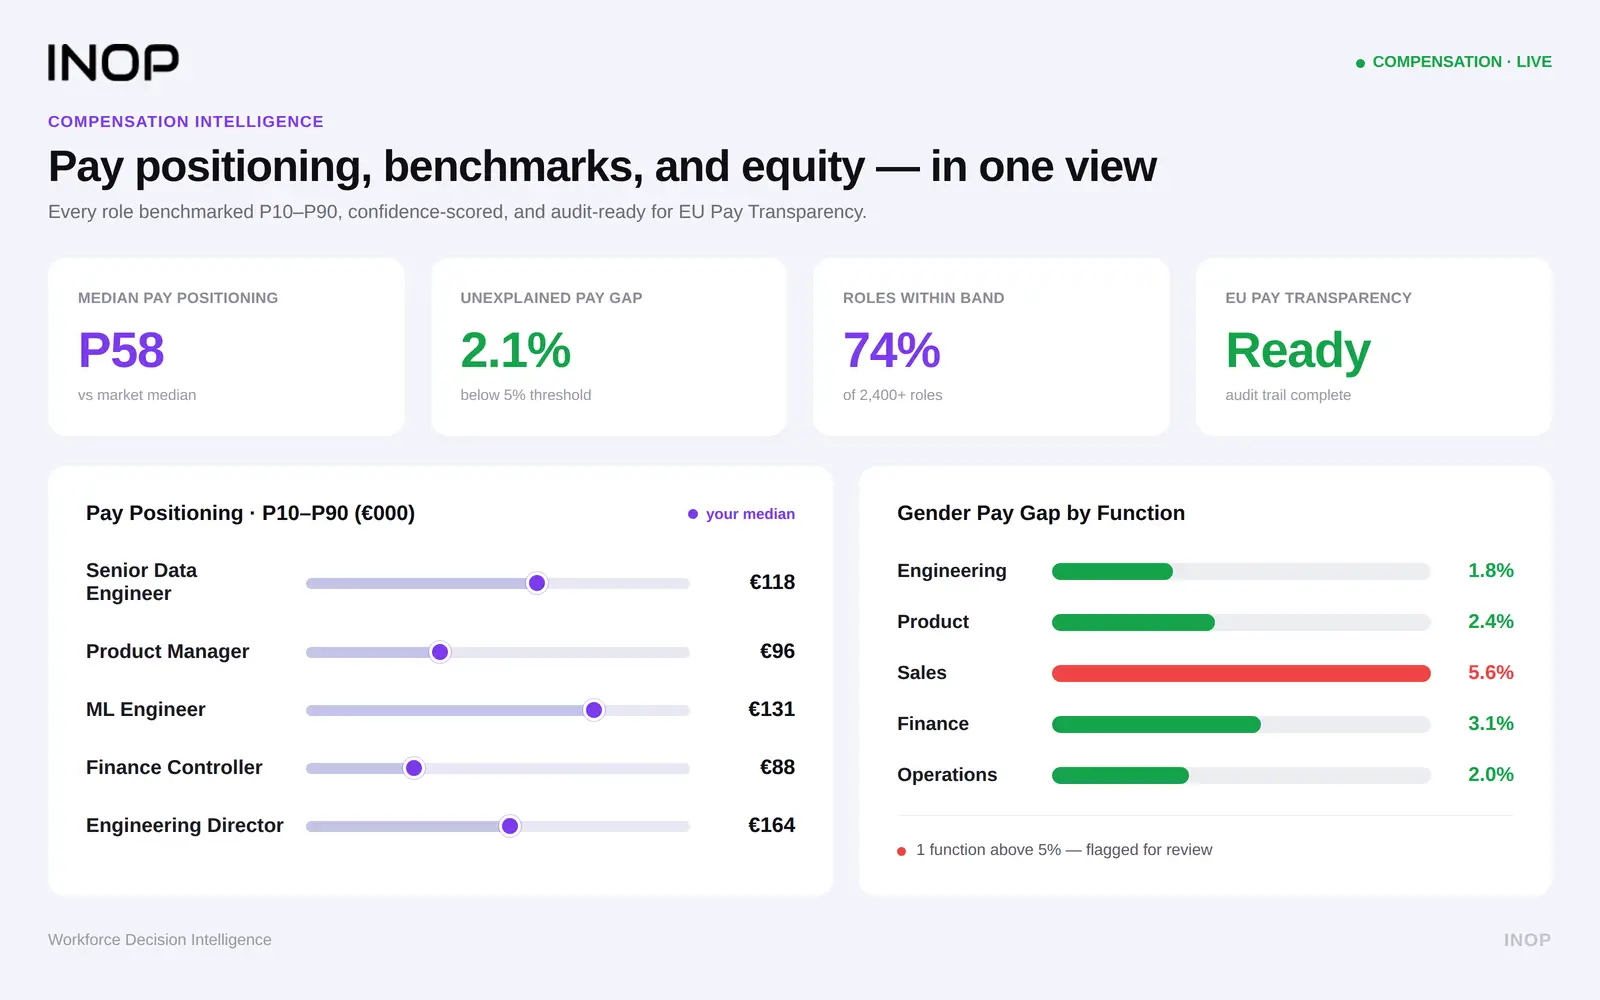
Analytics tests whether pay differences are explained by role, level, skills and performance, and where they are not. INOP’s compensation analytics platform benchmarks pay by role and skill and models the cost of changes.
Skills and Capability Gaps
Reports show training hours. Analytics shows whether the skills that matter are growing. INOP’s skills intelligence verifies skills from existing data and keeps them current. Start with what a skill gap is.
Leadership and Manager Effectiveness
Analytics can link manager practices to team outcomes such as engagement, absence and retention, so leadership development targets what makes a difference.
How to Build an HR Reporting and Analytics Function
Moving from reports to analytics takes four steps, plus clear ownership.
Start With Data Quality and Governance
Clean, consistent data comes first. Agree on definitions for core metrics, connect HR data with finance data, name owners and set access rules. Buying tools before fixing data moves the problem instead of solving it.
Define Business Questions Before Touching the Data
Start from a decision leaders need to make, such as where to invest in skills or how to reduce exits in a critical team. The question decides which data and methods you need.
Build Analytical Capability Step by Step
Begin with the analytics built into your current systems, then add specialist skills or a platform as questions grow. Prove value on one decision before widening scope.
Build a Culture of Evidence-Based Decisions
Bring data into leadership meetings, ask what evidence supports each proposal, and track whether decisions based on analysis worked. Culture decides whether insights get used.
Who Owns HR Reporting and Analytics
Reporting usually sits with HR operations or HRIS, which owns data quality and standard reports. Analytics sits with a people analytics team or specialists who work with finance and business leaders. The two need shared definitions and one source of truth, or every meeting starts with an argument about the numbers.
Common Misconceptions About HR Analytics
- “Analytics is only for large companies.” Smaller organizations have less data but simpler questions. Focused analysis on one decision can still pay off.
- “Analytics replaces judgment.” Models inform decisions. People still weigh context, fairness and trade-offs.
- “You need perfect data first.” You need data good enough for the first question. Improve it as you go.
- “A dashboard is analytics.” A dashboard is usually reporting. Analytics starts when you explain causes, forecast or compare options.
The Role of Technology in HR Reporting and Analytics
Modern platforms connect HR, finance and market data, automate routine reporting, and make models easier to use. AI helps with tasks such as inferring skills from text and spotting patterns across large datasets. Technology is an enabler, not a strategy. Choose tools after you know which decisions they must support.
HR Analytics for Private Equity Operating Partners
For private equity operating partners, standard HR reports from portfolio companies rarely answer the questions that matter: whether the workforce can deliver the plan, where key-person risk sits and what gaps will cost. Analytics answers them in a comparable way across the portfolio. See human capital risk for how workforce exposure affects value.
Conclusion: From What Happened to What Comes Next
HR reporting and analytics are not rivals. Reporting gives you an accurate record. Analytics turns that record into explanations, forecasts and options. The organizations that gain the most connect both to priced decisions about skills, pay and capacity. Start with clean data and one important question, prove the value, and build from there.
Ready to turn workforce data into decisions? INOP links verified skills, market data and cost in one view. Book a demo
HR Reporting and Analytics FAQs
What is the difference between HR reporting and HR analytics?
HR reporting describes what happened using historical data. HR analytics explains why it happened, predicts what is likely to happen and helps decide what to do.
What is the difference between HR analytics and people analytics?
The terms overlap. HR analytics often focuses on HR processes and programs, while people analytics looks more broadly at how people affect business results. Workforce analytics adds planning, cost and the full workforce, including contingent labor.
What are the levels of HR analytics?
There are four: descriptive (what happened), diagnostic (why it happened), predictive (what is likely to happen) and prescriptive (what to do about it). Reporting covers the first level.
What should an HR analytics report include?
The business question, the finding, the drivers behind it, a forecast if nothing changes, the options with cost and risk, and a recommendation with a named owner.
Is an HR dashboard reporting or analytics?
Most dashboards are reporting, because they show counts and trends. A dashboard becomes analytics when it explains causes, shows forecasts or compares options.
How does HR analytics connect to strategic workforce planning?
Analytics provides the evidence for planning: which skills the strategy needs, which the organization holds, and what each way of closing the gap costs. See strategic workforce planning frameworks.
Book a Demo
Make confident workforce decisions that support strategy and value creation.