The link between compensation and employee retention is one of the most direct levers HR controls. When pay falls behind the market, drifts out of line with internal peers or stops reflecting performance, people start looking elsewhere, usually before anyone notices. Compensation analytics turns that risk into something leaders can see and act on: it shows who is underpaid relative to the market, where pay gaps are driving attrition and where a targeted adjustment costs far less than a resignation. This guide explains how compensation affects retention, what to measure, how to build a pay-driven retention strategy, how data-driven pay builds trust and how to prove the impact.
How Compensation Affects Employee Retention
Pay is not the only reason people leave, but it is one of the few reasons an organization can fix quickly and measure precisely. It works on retention in three ways:
- Market position: when an employee is paid well below what the market offers for their skills, an outside offer becomes easy to accept.
- Internal fairness: when people discover that peers doing similar work earn more, trust drops even if their own pay is competitive.
- Recognition: when strong performers receive the same increase as everyone else, they conclude that effort is not rewarded.
Many departures are avoidable. Gallup found that 52 percent of voluntarily exiting employees said their manager or organization could have done something to prevent them from leaving, and it estimates the cost of replacing an employee at one-half to two times their annual salary. A pay adjustment for a scarce role is usually a fraction of that.
The Impact of Compensation Strategy on Retention
Strategy matters as much as the size of the budget. McKinsey describes a leading healthcare organization that found highly variable and unequal compensation levels were driving high attrition. After using analytics to set an optimal minimum and maximum compensation threshold, it reduced attrition and total compensation spending at the same time, and generated more than 100 million dollars in savings. The lesson: where money goes matters more than how much is spent.
What Compensation Analytics Measures for Retention
| Dimension | Key metric | Retention signal |
|---|---|---|
| Market competitiveness | Market position by percentile | People paid well below market in roles with strong external demand |
| Position in range | Compa-ratio and range penetration | Experienced people stuck low in their range |
| Internal equity | Unexplained gaps within the same role and level | Groups or individuals paid less than peers without a clear reason |
| Compression | New joiner pay compared with tenured staff | Longer-serving people earning less than recent joiners |
| Pay and performance | Increase size by performance rating | Top performers receiving average increases |
| Attrition link | Attrition rate by market position band | Where low pay and high exits overlap |
Compa-ratio compares pay with the midpoint of the range. Range penetration shows where someone sits between the range minimum and maximum; AIHR explains the calculation in its guide to salary range penetration. For the full set of metrics and definitions, see our guide to compensation analytics.
How People Analytics Teams Use Compensation Data to Reduce Turnover
- Get the data right. Combine pay, job level, location, performance, tenure and exit data from HRIS and payroll, mapped to a consistent job architecture.
- Benchmark against current market data. Stale benchmarks hide the gaps that matter. See how to benchmark salaries with real-time data, what a compensation benchmark is and how real-time compensation analytics supports pay decisions.
- Find where pay and attrition overlap. Compare attrition rates across market position bands, job families and locations.
- Flag individuals at risk. Combine pay position with other signals such as time since last increase or promotion, performance and skill scarcity. Read about AI flight risk models and predictive compensation analytics.
- Segment the response. Different groups need different fixes. A market adjustment for one role family, a compression fix for another, a recognition change for high performers.
- Price the options. Compare the cost of each adjustment with the cost of losing the people it protects.
Compensation and Employee Retention Analytics Beyond Pay
Pay is one driver among several. Employee retention analytics also looks at career movement, manager quality, workload and engagement. Use compensation data to rule pay in or out as the cause before spending budget on it. If people are paid competitively and still leaving, the fix is elsewhere, often in career paths. See AI for internal mobility and retention.
Pay-Driven Retention Strategies That Work
Targeted Market Adjustments
Increase budgets are tight. US salary increase budgets averaged 3.5 percent in 2026, with 3.4 percent expected in 2027, according to WTW data reported by SHRM. Spreading that evenly leaves little for the roles where pay is driving exits. Direct more of it to people who are below market in roles with high attrition and scarce skills.
Differentiating for Performance
Give strong performers visibly larger increases. A flat increase across the board tells top performers their extra contribution is not valued.
Fixing Compression
When new joiners are brought in at market rates, longer-serving colleagues can fall behind. Review compression every cycle and correct it before it becomes a reason to leave.
Using Retention Bonuses Carefully
Retention bonuses can protect critical people through a merger, a transformation or a key project. They delay a decision rather than fixing the underlying pay gap, so pair them with a plan to correct base pay.
Total Rewards Statements
Many employees underestimate the value of their full package. Personalized total rewards statements showing base pay, variable pay, benefits and equity help people compare accurately with outside offers.
See where pay is putting your people at risk. INOP combines market pay, equity and attrition signals in one view. Book a demo
How Data-Driven Pay Builds Trust and Retention
Trust in how pay is decided matters as much as the amount. People stay when they believe the process is fair, even if their pay is not the highest in the market.
Transparency Reduces Uncertainty
When employees understand how pay ranges are set and how they can progress, they spend less time guessing and comparing. Clear pay bands and published ranges give them a reference point. See our guide to building pay bands.
Pay Equity Becomes Measurable
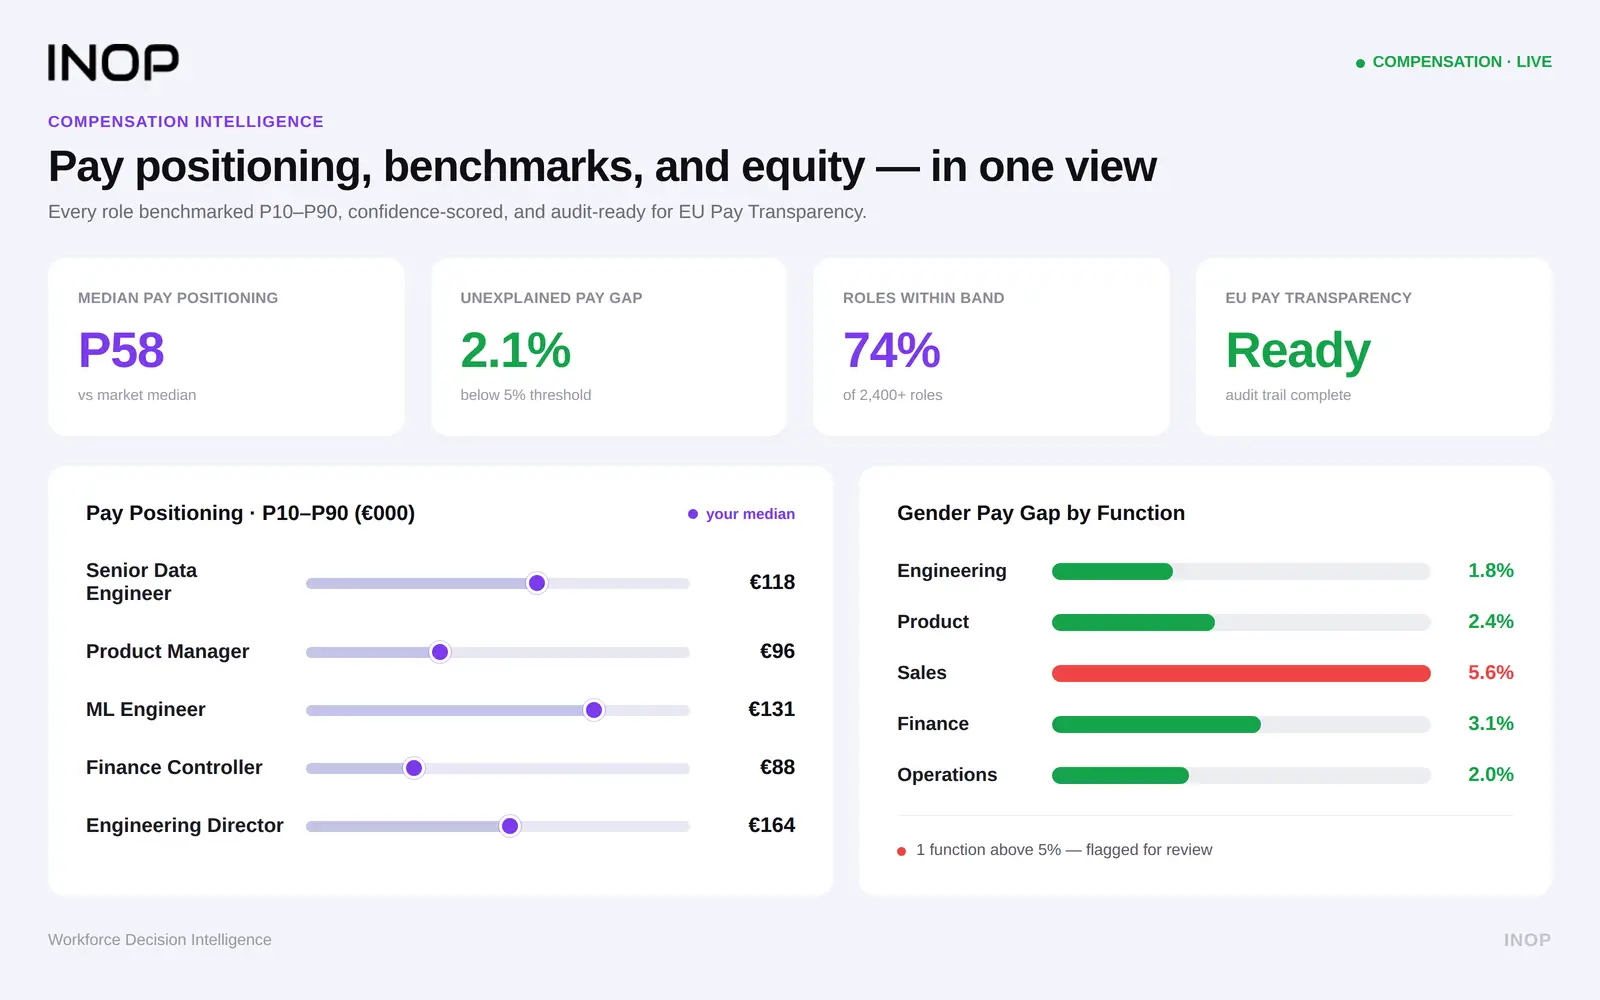
Data-driven pay replaces assumptions with evidence. Equity analysis separates gaps explained by role, level and experience from gaps that are not, so they can be fixed. See pay parity.
Communicating Pay Decisions Clearly
Train managers to explain pay decisions using the same data HR uses: market position, range and performance. An adjustment explained with evidence builds more trust than a larger one with no explanation.
| Dimension | Traditional pay decisions | Data-driven pay decisions |
|---|---|---|
| Basis | Negotiation, history and manager judgment | Market data, equity analysis and performance |
| Timing | Annual cycle or after a resignation | Continuous, before risk becomes an exit |
| Consistency | Varies by manager | Same criteria across teams |
| Explanation to employees | Limited | Based on clear ranges and evidence |
| Effect on trust | Suspicion of unfairness | Confidence in the process |
Pay Transparency Rules Raise the Stakes
In Europe, the Pay Transparency Directive makes this a legal requirement as well as a retention issue. According to Morgan Lewis, employers with more than 250 employees, and those with 150 to 249 employees, must publish their first gender pay gap report by 7 June 2027. A published, unexplained gap is a reason for employees to question fairness, so fix it first.
Connecting Compensation and Retention to Wider Workforce Decisions
Retention-driven pay decisions should not be made in isolation. A role that is hard to keep filled might be better redeployed, reshaped or partly automated than repeatedly repriced. INOP’s BBRA decision architecture compares four options for every capability gap: Build, Buy, Redeploy, Automate, with financial trade-offs across 30-day, 180-day, one-year and three-year horizons. The strategic workforce planning platform puts pay and retention costs alongside those options, and skills intelligence shows which skills are scarce in the market and therefore most exposed to outside offers. For budget planning, see compensation scenario planning.
Measuring the Impact on Retention
| Metric | What it shows |
|---|---|
| Voluntary turnover rate | Overall exits, by team and role family |
| Regretted turnover | Loss of people the organization wanted to keep |
| Attrition by market position band | Whether pay adjustments reduced exits where pay was the issue |
| Replacement cost avoided | The financial return on retention spending |
| Pay fairness scores in engagement surveys | Whether employees trust how pay is decided |
| Exit reasons citing pay | Whether pay is still a stated reason for leaving |
An illustrative example: a 1,000-person company with 15 percent voluntary turnover loses 150 people a year. If analysis shows that a quarter of those exits are pay-related, and targeted adjustments halve them, turnover falls by about 19 people a year, or roughly two percentage points. With replacement costs of one-half to two times salary, the savings usually exceed the cost of the adjustments. Use your own data to test this. To present these results to leadership, read how to build an HR analytics dashboard the C-suite uses.
The payoff from getting people decisions right is broad. McKinsey Global Institute research on about 1,800 companies found that firms prioritizing both people and performance had attrition about five percentage points lower than other companies.
Common Pitfalls
- Using stale market data. Gaps open faster than annual surveys can show.
- Looking only at base salary. Variable pay and benefits change the comparison.
- Spreading the budget evenly. It leaves too little for the roles that need it.
- Ignoring internal equity. Fixing market gaps can create new internal ones.
- Adjusting pay without explaining it. Unexplained changes do little for trust.
- Assuming pay is always the cause. Confirm with data before spending.
How INOP Approaches Compensation and Employee Retention
INOP answers whether leaders have the capabilities to execute their strategy today and stay AI-ready. It never assesses AI in isolation and tests every pay decision against five intelligence lenses: Strategy, Finance, People, Market, and AI and Automation. The compensation analytics platform benchmarks pay against current market data, tests equity, flags pay-driven flight risk and prices adjustments against the cost of losing people. For the wider approach, see what a data-driven compensation strategy looks like. For private equity operating partners, the same view shows where pay creates retention risk in critical roles across a portfolio.
Conclusion
Compensation and employee retention are closely linked, but spending more is not the answer on its own. Find where pay and attrition overlap, direct a tight budget to the people and roles that need it, fix equity and compression, explain decisions clearly and measure the result. Done consistently, compensation analytics keeps the people the business depends on while spending less to do it.
Keep the people your strategy depends on. INOP links pay, skills and market data to priced retention decisions. Book a demo
Compensation and Employee Retention FAQs
How does compensation affect employee retention?
Pay affects retention through market competitiveness, internal fairness and recognition of performance. When any of these falls short, outside offers become easier to accept.
How can compensation analytics help identify flight risk?
It combines pay position against the market, time since the last increase or promotion, performance and skill scarcity to flag people and teams most likely to leave for pay reasons.
What compensation metrics matter most for retention?
Market position, compa-ratio, range penetration, unexplained pay gaps, compression and attrition rates by market position band.
How does data-driven pay build trust?
It makes pay decisions consistent, explainable and measurable, so employees can see how ranges are set and that similar work is paid similarly.
How often should pay be reviewed for retention risk?
Run a full review at least once a year, monitor high-risk roles and fast-moving markets quarterly and act between cycles when the data shows a gap.
Can small organizations use compensation analytics for retention?
Yes. Start with clean pay data, a reliable market benchmark and a simple comparison of attrition by pay position, then add more as the organization grows.